

Predictors and prognosis of right ventricular function in pulmonary hypertension due to heart failure with reduced ejection fraction
- PMID: 33934536
- PMCID: PMC8318446
- DOI: 10.1002/ehf2.13386
Predictors and prognosis of right ventricular function in pulmonary hypertension due to heart failure with reduced ejection fraction
Abstract
Aims: Failure of right ventricular (RV) function worsens outcome in pulmonary hypertension (PH). The adaptation of RV contractility to afterload, the RV-pulmonary artery (PA) coupling, is defined by the ratio of RV end-systolic to PA elastances (Ees/Ea). Using pressure-volume loop (PV-L) technique we aimed to identify an Ees/Ea cut-off predictive for overall survival and to assess hemodynamic and morphologic conditions for adapted RV function in secondary PH due to heart failure with reduced ejection fraction (HFREF).
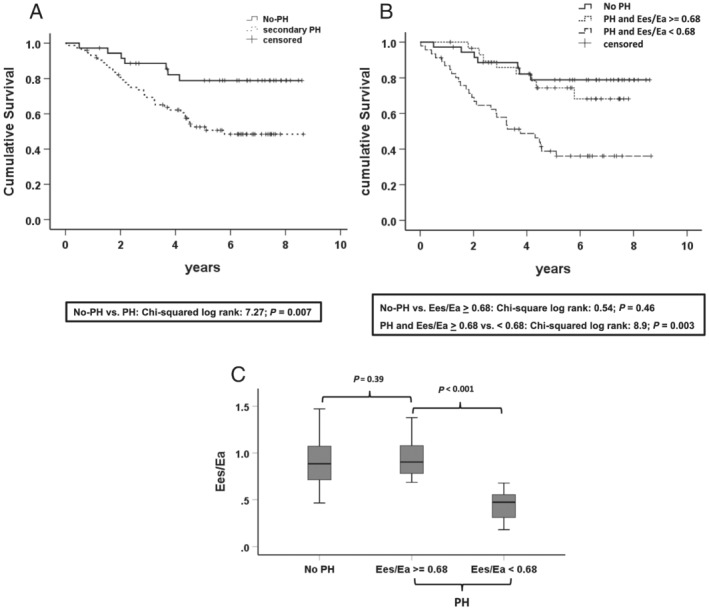
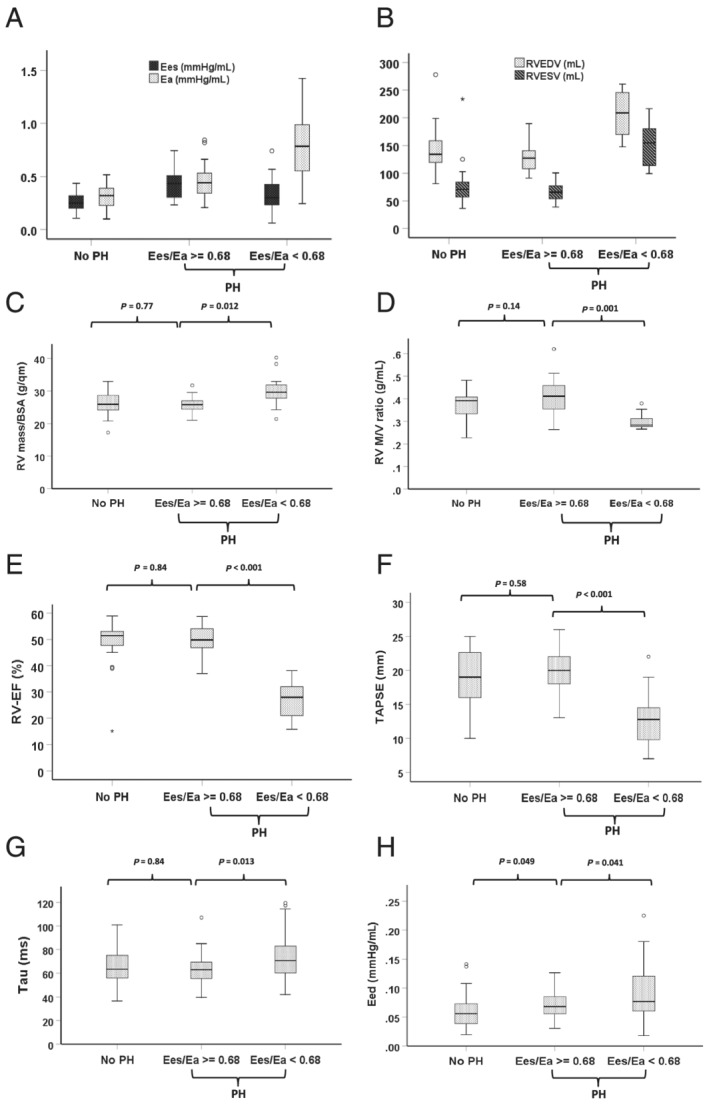
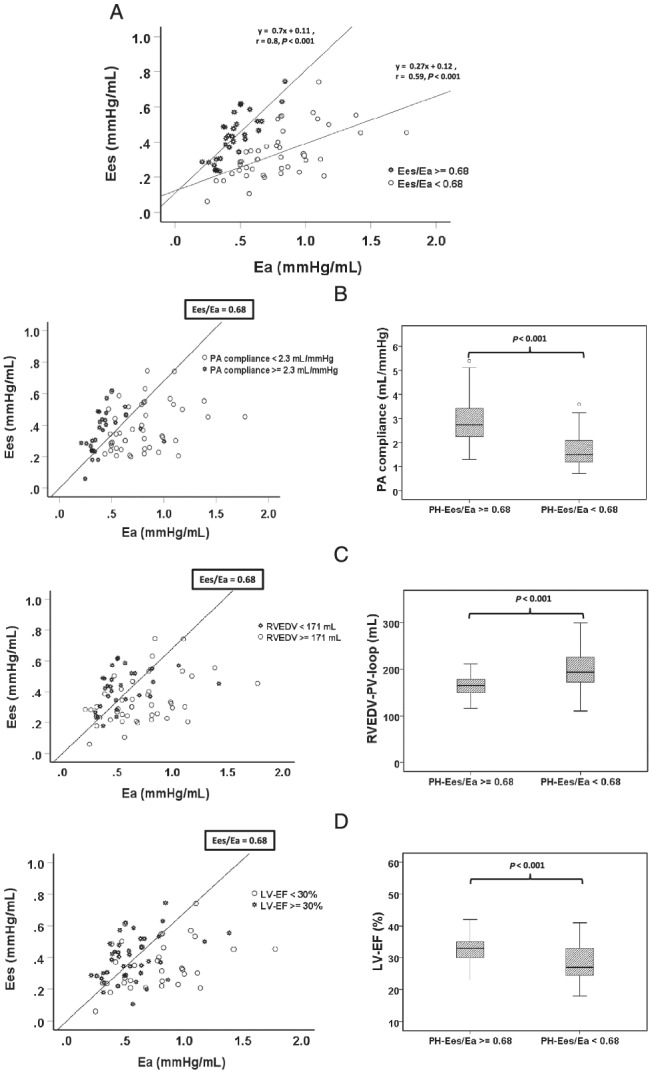
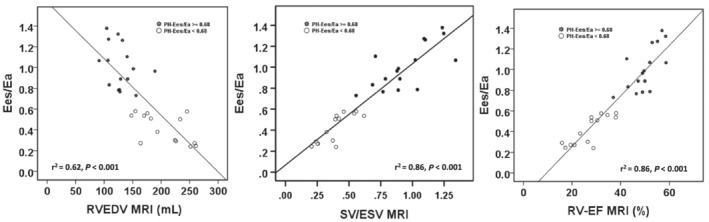
Methods and results: This post hoc analysis is based on 112 patients of the prospective Magdeburger Resynchronization Responder Trial. All patients underwent right and left heart echocardiography and a baseline PV-L and RV catheter measurement. A subgroup of patients (n = 50) without a pre-implanted cardiac device underwent magnetic resonance imaging at baseline. The analysis revealed that 0.68 is an optimal Ees/Ea cut-off (area under the curve: 0.697, P < 0.001) predictive for overall survival (median follow up = 4.7 years, Ees/Ea ≥ 0.68 vs. <0.68, log-rank 8.9, P = 0.003). In patients with PH (n = 76, 68%) multivariate Cox regression demonstrated the independent prognostic value of RV-Ees/Ea in PH patients (hazard ratio 0.2, P < 0.038). Patients without PH (n = 36, 32%) and those with PH but RV-Ees/Ea ≥ 0.68 showed comparable RV-Ees/Ea ratios (0.88 vs. 0.9, P = 0.39), RV size/function, and survival. In contrast, secondary PH with RV-PA coupling ratio Ees/Ea < 0.68 corresponded extremely close to cut-off values that define RV dilatation/remodelling (RV end-diastolic volume >160 mL, RV-mass/volume-ratio ≤0.37 g/mL) and dysfunction (right ventricular ejection fraction <38%, tricuspid annular plane systolic excursion <16 mm, fractional area change <42%, and stroke-volume/end-systolic volume ratio <0.59) and is associated with a dramatically increased short and medium-term all-cause mortality. Independent predictors of prognostically unfavourable RV-PA coupling (Ees/Ea < 0.68) in secondary PH were a pre-existent dilated RV [end-diastolic volume >171 mL, odds ratio (OR) 0.96, P = 0.021], high pulsatile load (PA compliance <2.3 mL/mmHg, OR 8.6, P = 0.003), and advanced systolic left heart failure (left ventricular ejection fraction <30%, OR 1.23, P = 0.028).
Conclusions: The RV-PA coupling ratio Ees/Ea predicts overall survival in PH due to HFREF and is mainly affected by pulsatile load, RV remodelling, and left ventricular dysfunction. Prognostically favourable coupling (RV-Ees/Ea ≥ 0.68) in PH was associated with preserved RV size/function and mid-term survival, comparable with HFREF without PH.
Keywords: Arterial elastance; End-systolic elastance; Pressure-volume loops; RVEF, TAPSE, FAC, PA compliance; Right ventricle-pulmonary arterial coupling.
© 2021 The Authors. ESC Heart Failure published by John Wiley & Sons Ltd on behalf of European Society of Cardiology.
Conflict of interest statement
There is no conflict of interest.
Figures
Similar articles
-
Pressure-volume loop validation of TAPSE/PASP for right ventricular arterial coupling in heart failure with pulmonary hypertension.Eur Heart J Cardiovasc Imaging. 2021 Jan 22;22(2):168-176. doi: 10.1093/ehjci/jeaa285. Eur Heart J Cardiovasc Imaging. 2021. PMID: 33167032 Clinical Trial.
-
Validation of the Tricuspid Annular Plane Systolic Excursion/Systolic Pulmonary Artery Pressure Ratio for the Assessment of Right Ventricular-Arterial Coupling in Severe Pulmonary Hypertension.Circ Cardiovasc Imaging. 2019 Sep;12(9):e009047. doi: 10.1161/CIRCIMAGING.119.009047. Epub 2019 Sep 10. Circ Cardiovasc Imaging. 2019. PMID: 31500448 Free PMC article.
-
Adaptive versus maladaptive right ventricular remodelling.ESC Heart Fail. 2023 Apr;10(2):762-775. doi: 10.1002/ehf2.14233. Epub 2022 Nov 23. ESC Heart Fail. 2023. PMID: 36419369 Free PMC article. Review.
-
Reserve of Right Ventricular-Arterial Coupling in the Setting of Chronic Overload.Circ Heart Fail. 2019 Jan;12(1):e005512. doi: 10.1161/CIRCHEARTFAILURE.118.005512. Circ Heart Fail. 2019. PMID: 30616360
-
Application of an echocardiographic index to characterize right ventricular-pulmonary arterial coupling in heart failure.ESC Heart Fail. 2024 Jun;11(3):1290-1304. doi: 10.1002/ehf2.14663. Epub 2024 Jan 16. ESC Heart Fail. 2024. PMID: 38229524 Free PMC article. Review.
Cited by
-
Non-invasive surrogates for right Ventricular-Pulmonary arterial coupling: a systematic review and Meta-Analysis.Pulm Circ. 2024 Oct 21;14(4):e70004. doi: 10.1002/pul2.70004. eCollection 2024 Oct. Pulm Circ. 2024. PMID: 39439999 Free PMC article.
-
Right ventricular dysfunction for prediction of long-term recovery in de novo HFrEF : a PROLONG-II substudy.ESC Heart Fail. 2025 Jun;12(3):2166-2176. doi: 10.1002/ehf2.15236. Epub 2025 Feb 4. ESC Heart Fail. 2025. PMID: 39905162 Free PMC article. Clinical Trial.
-
Clinical Usefulness of Right Ventricle-Pulmonary Artery Coupling in Cardiovascular Disease.J Clin Med. 2023 Mar 27;12(7):2526. doi: 10.3390/jcm12072526. J Clin Med. 2023. PMID: 37048609 Free PMC article. Review.
-
Natural Products for the Treatment of Pulmonary Hypertension: Mechanism, Progress, and Future Opportunities.Curr Issues Mol Biol. 2023 Mar 13;45(3):2351-2371. doi: 10.3390/cimb45030152. Curr Issues Mol Biol. 2023. PMID: 36975522 Free PMC article. Review.
-
Chest CT signs and serum homocysteine levels can effectively diagnose chronic heart failure.Am J Transl Res. 2025 Apr 15;17(4):3085-3093. doi: 10.62347/BOIQ3903. eCollection 2025. Am J Transl Res. 2025. PMID: 40385067 Free PMC article.
References
-
- Maughan WL, Shoukas AA, Sagawa K, Weisfeldt ML. Instantaneous pressure–volume relationship of the canine right ventricle. Circ Res 1979; 44: 309–315. - PubMed
-
- Sanz J, Sánchez‐Quintana D, Bossone E, Bogaard HJ, Naeije R. Anatomy, function, and dysfunction of the right ventricle: JACC state‐of‐the‐art review. J Am Coll Cardiol 2019; 73: 1463–1482. - PubMed
-
- Kass DA, Kelly RP. Ventriculo‐arterial coupling: concepts, assumptions, and applications. Ann Biomed Eng United States 1992; 20: 41–62. - PubMed
-
- Sagawa K, Maughan L, Suga H, Sunagawa K. Cardiac Contraction and the Pressure–Volume Relationship. New York: Oxford University Press; 1988.
-
- Tello K, Dalmer A, Axmann J, Vanderpool R, Ghofrani HA, Naeije R, Roller F, Seeger W, Sommer N, Wilhelm J, Gall H, Richter MJ. Reserve of right ventricular‐arterial coupling in the setting of chronic overload. Circ Heart Fail 2019; 12: e005512. - PubMed
Publication types
MeSH terms
Associated data
LinkOut - more resources
Full Text Sources
Medical
