. 2021 Oct;36(10):3358-3361.
doi: 10.1016/j.arth.2021.04.014. Epub 2021 Apr 22.

Living With Survival Analysis in Orthopedics

Affiliations

Living With Survival Analysis in Orthopedics

Cynthia S Crowson et al. J Arthroplasty. 2021 Oct.

Abstract

Time to event data occur commonly in orthopedics research and require special methods that are often called "survival analysis." These data are complex because both a follow-up time and an event indicator are needed to correctly describe the occurrence of the outcome of interest. Common pitfalls in analyzing time to event data include using methods designed for binary outcomes, failing to check proportional hazards, ignoring competing risks, and introducing immortal time bias by using future information. This article describes the concepts involved in time to event analyses as well as how to avoid common statistical pitfalls. Please visit the followinghttps://youtu.be/QNETrx8B6IUandhttps://youtu.be/8SBoTr9Jy1Qfor videos that explain the highlights of the paper in practical terms.

Keywords: Cox model; censoring; survival analysis; time-to-event analysis; total joint arthroplasty.


Figures

Figure 1.
Figure 1.
An example of a typical observational data cohort. Each subject has their arthroplasty at a different time and all are followed for different lengths of time. The left panel shows the observation time for each patient according to calendar time. The right panel shows the same data plotted according to time since arthroplasty. Events are marked with an ‘X’ at the end of follow-up and censored patients are marked with an ‘O’.
Figure 2.
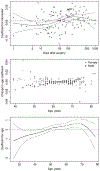
Figure 2.. Depiction of plots to check assumptions of the Cox model.
The upper panel demonstrates a violation of the proportional hazards assumption. The coefficient for the biomarker changes over time (solid line with 95% confidence intervals shown with dashed lines); it is less than the average coefficient (dashed line) for the first 100 days and then increases to more than the average coefficient after 100 days. The middle panel shows influential points in the upper left and bottom right corner of the figure, which correspond to changes in the coefficient for age of >0.4 increase and decease, respectively. The bottom panel shows a potential non-linear relationship, where the coefficient for age is <0 prior to age 50 years, becomes >0 for ages 50-70 years, and then downturns after age 70 years.

References

    1. Larson DR, Crowson CS, Lewallen DG, Berry DJ, Maradit Kremers H. Immortal Time Bias in the Analysis of Time to Event Data in Orthopedics. J Arthroplasty in press, 2021 - PMC - PubMed
    1. Maradit Kremers H, Larson DR, Lewallen DG, Berry DJ, Crowson CS. Competing Risk Analysis: What Does It Mean and When Do We Need It in Orthopedics. J Arthroplasty in press, 2021 - PMC - PubMed
    1. Lundgreen C, Larson DR, Atkinson EJ, Lewallen DG, Berry DJ, Maradit Kremers H, et al.Adjusted Survival Curves Improve Comparisons When There is an Imbalance of Confounders Between Groups. J Arthroplasty in press, 2021 - PMC - PubMed
    1. Kaplan EL, Meier P. Nonparametric estimation from incomplete observations. J Am Stat Assoc 53(457-81), 1958
    1. Murray DW, Carr AJ, Bulstrode C. Survival analysis of joint replacements. J Bone Joint Surg Br 75(5): 697, 1993 - PubMed

Publication types

LinkOut - more resources