

Social Distancing and SARS-CoV-2 Transmission Potential Early in the Epidemic in Finland
- PMID: 33935135
- PMCID: PMC8174141
- DOI: 10.1097/EDE.0000000000001344
Social Distancing and SARS-CoV-2 Transmission Potential Early in the Epidemic in Finland
Abstract
Background: Information about social mixing patterns under heavy social distancing is needed to model the impact of nonpharmaceutical interventions on SARS-CoV-2 transmission.
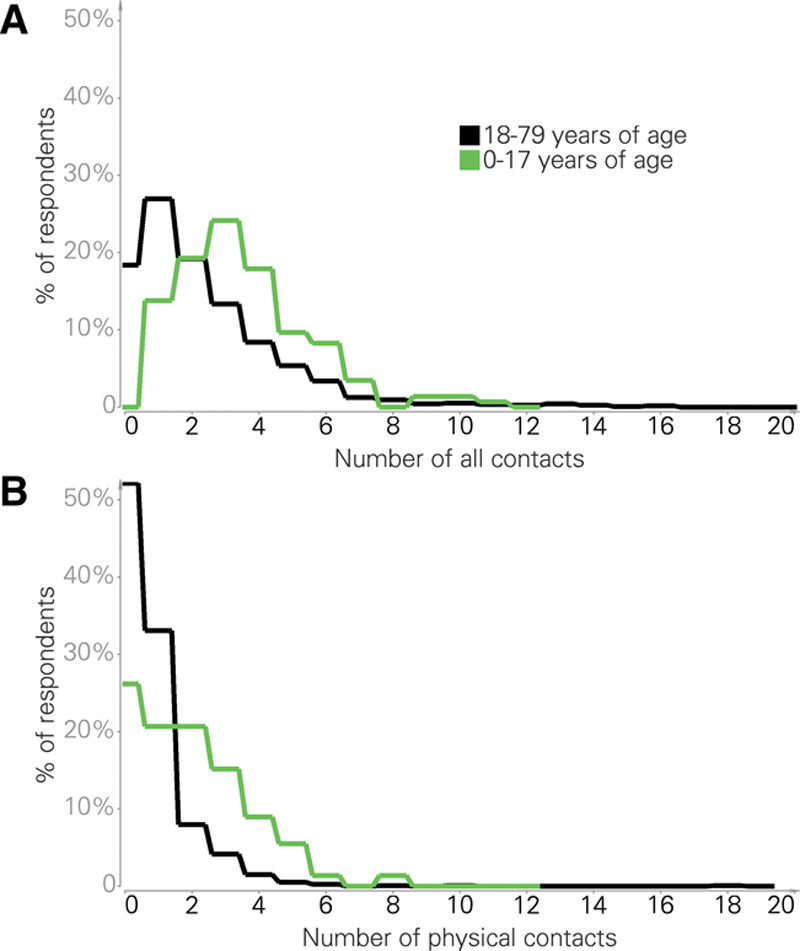
Methods: We conducted a survey on daily person-to-person contacts during the early phase of the SARS-CoV-2 epidemic in Finland, one month after strong social distancing measures had been introduced nationwide. We defined a contact as exchange of at least a few words in proximity of another person. We also considered physical ("skin-to-skin") contacts separately. Based on 3,171 reported contacts by 1,320 participants of 1-79 years of age, we estimated age-stratified contact matrices essential in modeling virus transmission.
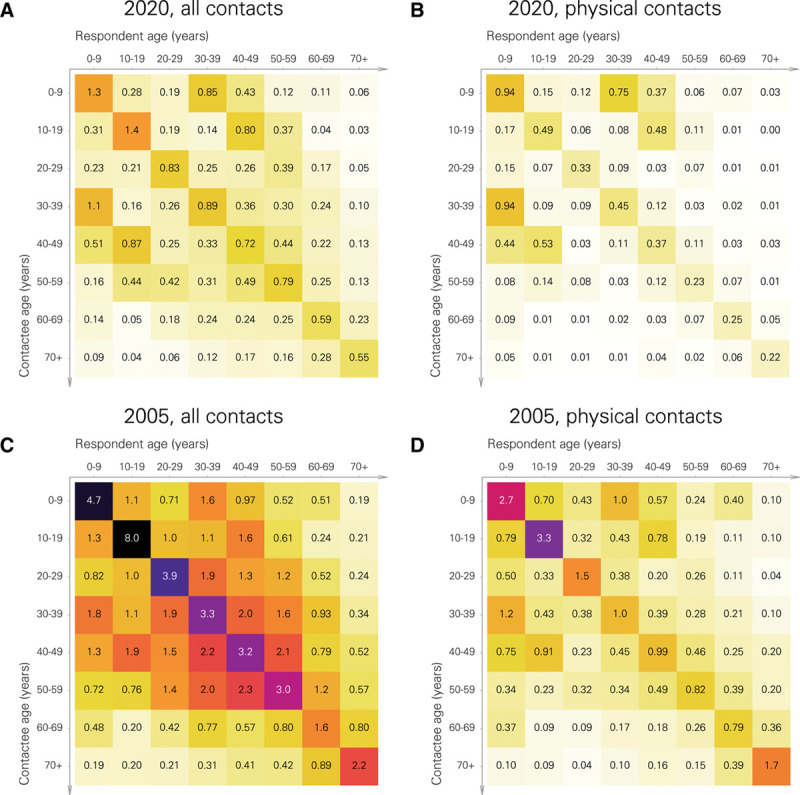
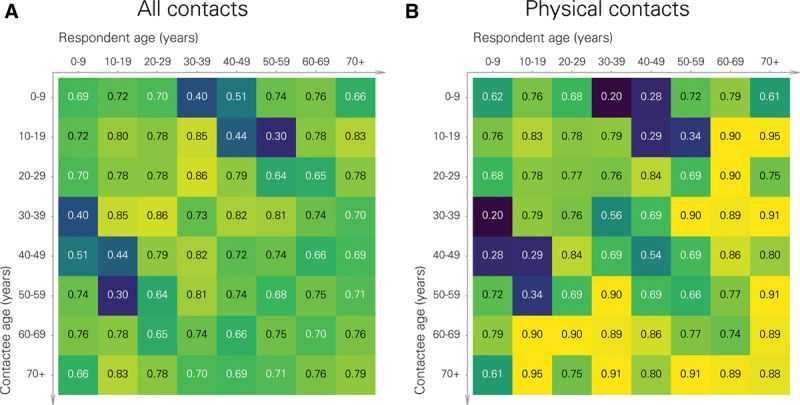
Results: Compared with contacts during prepandemic conditions, as learned from the Finnish part of the Polymod study, there was a 72% (95% credible interval, CI = 71, 74) reduction in the daily number of all contacts and a 69% (95% CI = 66, 73) reduction in the daily number of physical contacts in April 2020. The largest reduction, of almost 90%, occurred in physical contacts by individuals more than 70 years of age. The estimated reduction in the transmission potential of the virus attributable solely to reduced contact frequencies varied between 59% (whole population; physical contacts; 95% CI = 52, 68) and 77% (over 20-year olds; physical contacts; 95% CI = 70, 89).
Conclusions: We surmise that the large reduction in the daily numbers of social contacts in the early part of the SARS-CoV-2 epidemic in Finland was likely a major contributor to the steady decline of the epidemic in the country since early April.
Copyright © 2021 The Author(s). Published by Wolters Kluwer Health, Inc.
Conflict of interest statement
The authors report no funding and conflicts of interest.
Figures
 . See eTables 1;
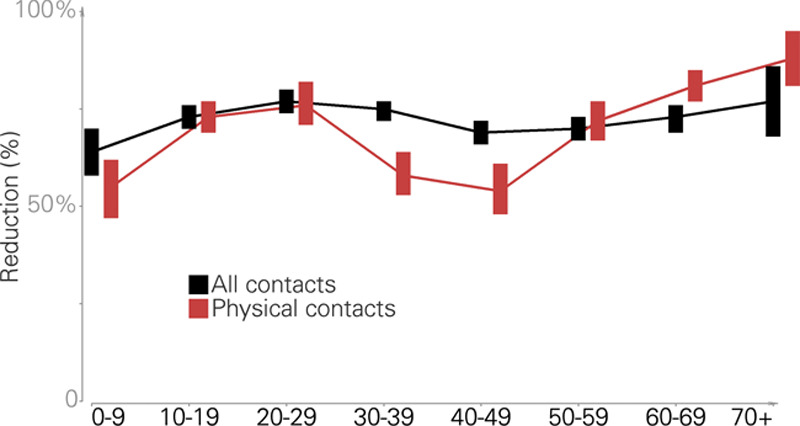
Similar articles
-
Impact of the Covid-19 epidemic and related social distancing regulations on social contact and SARS-CoV-2 transmission potential in rural South Africa: analysis of repeated cross-sectional surveys.BMC Infect Dis. 2021 Sep 8;21(1):928. doi: 10.1186/s12879-021-06604-8. BMC Infect Dis. 2021. PMID: 34496771 Free PMC article.
-
Transmission dynamics and control of two epidemic waves of SARS-CoV-2 in South Korea.BMC Infect Dis. 2021 May 26;21(1):485. doi: 10.1186/s12879-021-06204-6. BMC Infect Dis. 2021. PMID: 34039296 Free PMC article.
-
Social contact patterns during the early COVID-19 pandemic in Norway: insights from a panel study, April to September 2020.BMC Public Health. 2024 May 29;24(1):1438. doi: 10.1186/s12889-024-18853-8. BMC Public Health. 2024. PMID: 38811933 Free PMC article.
-
[What is the effect of social distancing on the course of COVID-19 epidemic?].Pol Merkur Lekarski. 2021 Feb 24;49(289):71-79. Pol Merkur Lekarski. 2021. PMID: 33713099 Review. Polish.
-
Rapid Review of Social Contact Patterns During the COVID-19 Pandemic.Epidemiology. 2021 Nov 1;32(6):781-791. doi: 10.1097/EDE.0000000000001412. Epidemiology. 2021. PMID: 34392254 Free PMC article.
Cited by
-
Impact of Selected Meteorological Factors on COVID-19 Incidence in Southern Finland during 2020-2021.Int J Environ Res Public Health. 2022 Oct 17;19(20):13398. doi: 10.3390/ijerph192013398. Int J Environ Res Public Health. 2022. PMID: 36293991 Free PMC article.
-
Efficacy and effectiveness of case isolation and quarantine during a growing phase of the COVID-19 epidemic in Finland.Sci Rep. 2023 Jan 6;13(1):298. doi: 10.1038/s41598-022-27227-2. Sci Rep. 2023. PMID: 36609431 Free PMC article.
-
Influences of COVID-19 pandemic on hospital-at-home functions in Finland - a questionnaire survey.Scand J Prim Health Care. 2022 Sep;40(3):379-384. doi: 10.1080/02813432.2022.2139475. Epub 2022 Nov 3. Scand J Prim Health Care. 2022. PMID: 36325735 Free PMC article.
-
The role of social network structure and function in moderate and severe social and emotional loneliness: The Dutch SaNAE study in older adults.Heliyon. 2023 Dec 16;10(1):e23734. doi: 10.1016/j.heliyon.2023.e23734. eCollection 2024 Jan 15. Heliyon. 2023. PMID: 38226216 Free PMC article.
-
Underreporting of SARS-CoV-2 infections during the first wave of the 2020 COVID-19 epidemic in Finland-Bayesian inference based on a series of serological surveys.PLoS One. 2023 Jun 23;18(6):e0282094. doi: 10.1371/journal.pone.0282094. eCollection 2023. PLoS One. 2023. PMID: 37352274 Free PMC article.
References
-
- Finnish Government. Report on the first phase of the working group on the coronavirus exit and reconstruction strategy (in Finnish). Available at: https://valtioneuvosto.fi/documents/10616/21411573/VN_2020_12.pdf. 2020. Accessed June 20, 2020.
-
- Finnish Government. Press release regarding the declaration of a state of emergency in Finland over coronavirus outbreak. 2020. Available at: https://valtioneuvosto.fi/-/10616/hallitus-totesi-suomen-olevan-poikkeus.... Accessed June 25, 2020.
-
- Finnish Institute for Health and Welfare (THL). Situation update on coronavirus. 2020. Available at: https://thl.fi/fi/web/infektiotaudit-ja-rokotukset/ajankohtaista/ajankoh.... Accessed June 24, 2020.
MeSH terms
LinkOut - more resources
Full Text Sources
Other Literature Sources
Medical
Miscellaneous
