

Estimating the Cumulative Incidence of SARS-CoV-2 Infection and the Infection Fatality Ratio in Light of Waning Antibodies
- PMID: 33935138
- PMCID: PMC8162228
- DOI: 10.1097/EDE.0000000000001361
Estimating the Cumulative Incidence of SARS-CoV-2 Infection and the Infection Fatality Ratio in Light of Waning Antibodies
Abstract
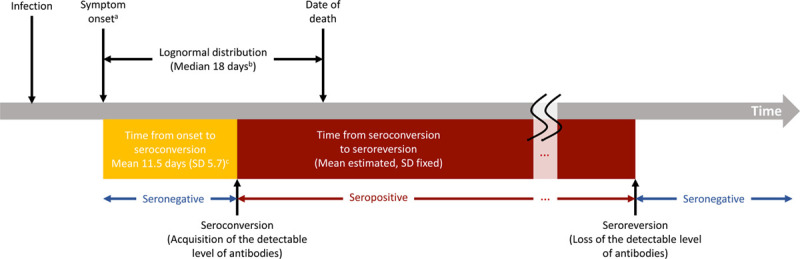
Background: Serology tests can identify previous infections and facilitate estimation of the number of total infections. However, immunoglobulins targeting severe acute respiratory syndrome coronavirus 2 (SARS-CoV-2) have been reported to wane below the detectable level of serologic assays (which is not necessarily equivalent to the duration of protective immunity). We estimate the cumulative incidence of SARS-CoV-2 infection from serology studies, accounting for expected levels of antibody acquisition (seroconversion) and waning (seroreversion), and apply this framework using data from New York City and Connecticut.
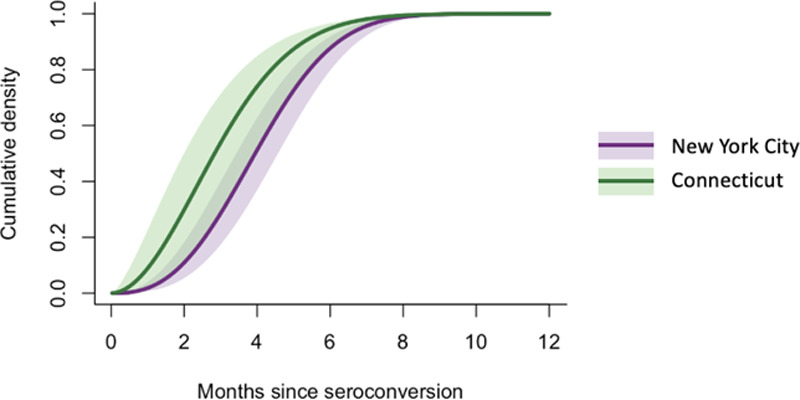
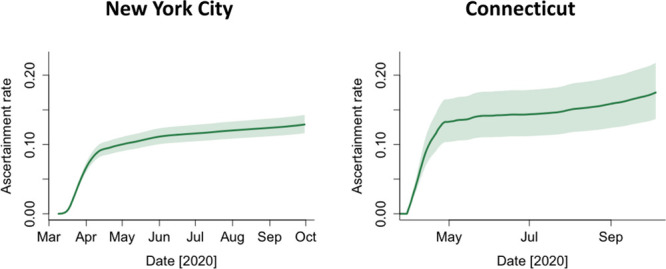
Methods: We estimated time from seroconversion to seroreversion and infection fatality ratio (IFR) using mortality data from March to October 2020 and population-level cross-sectional seroprevalence data from April to August 2020 in New York City and Connecticut. We then estimated the daily seroprevalence and cumulative incidence of SARS-CoV-2 infection.
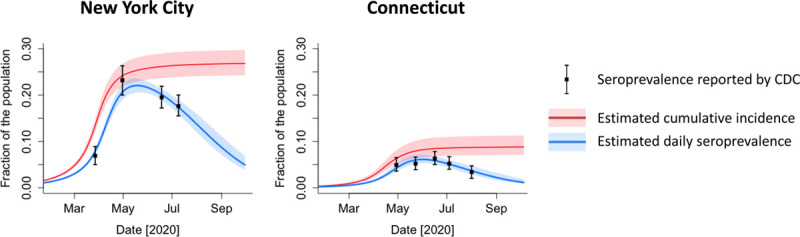
Results: The estimated average time from seroconversion to seroreversion was 3-4 months. The estimated IFR was 1.1% (95% credible interval, 1.0%, 1.2%) in New York City and 1.4% (1.1, 1.7%) in Connecticut. The estimated daily seroprevalence declined after a peak in the spring. The estimated cumulative incidence reached 26.8% (24.2%, 29.7%) at the end of September in New York City and 8.8% (7.1%, 11.3%) in Connecticut, higher than maximum seroprevalence measures (22.1% and 6.1%), respectively.
Conclusions: The cumulative incidence of SARS-CoV-2 infection is underestimated using cross-sectional serology data without adjustment for waning antibodies. Our approach can help quantify the magnitude of underestimation and adjust estimates for waning antibodies.
Copyright © 2021 The Author(s). Published by Wolters Kluwer Health, Inc.
Conflict of interest statement
B.A.L. reports personal fees from Takeda Pharmaceutical, personal fees from CDC Foundation, and personal fees from Hall Booth Smith, P.C., outside the submitted work. The other authors have no conflicts to report.
Figures
Update of
-
Estimating the cumulative incidence of SARS-CoV-2 infection and the infection fatality ratio in light of waning antibodies.medRxiv [Preprint]. 2020 Nov 16:2020.11.13.20231266. doi: 10.1101/2020.11.13.20231266. medRxiv. 2020. Update in: Epidemiology. 2021 Jul 1;32(4):518-524. doi: 10.1097/EDE.0000000000001361. PMID: 33236035 Free PMC article. Updated. Preprint.
References
-
- Johns Hopkins Coronavirus Resource Center. COVID-19 Map. Available at: https://coronavirus.jhu.edu/map.html. Accessed 8 October 2020.
Publication types
MeSH terms
Substances
Grants and funding
LinkOut - more resources
Full Text Sources
Other Literature Sources
Medical
Miscellaneous
