. 2021 Apr 15:12:649554.
doi: 10.3389/fphys.2021.649554. eCollection 2021.

Effects of Non-directional Mechanical Trauma on Gastrointestinal Tract Injury in Rats

Affiliations

Effects of Non-directional Mechanical Trauma on Gastrointestinal Tract Injury in Rats

Lihong Liu et al. Front Physiol. .

Abstract

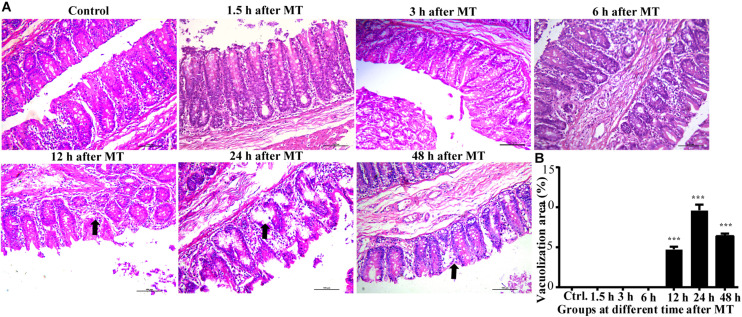
Mechanical trauma can (MT) cause secondary injury, such as cardiomyocyte apoptosis and cardiac dysfunction has been reported. However, the effects of mechanical trauma on gastrointestinal tract is unclear. This study aims to observe the main location and time of gastrointestinal tract injury caused by non-directional trauma and explain the reason of the increase of LPS in blood caused by mechanical injury. Morphological changes in the stomach, ileum and cecum at different time points after MT were observed in this experiment. The results reveal that the injury to the cecal mucosa in the rats was more obvious than that in the ileum and the stomach. The cecal epithelial cell junction was significantly widened at 20 min after MT, and the plasma LPS and D-lactic acid concentrations increased significantly at the same time point. In addition, some bacterial structures in the widened intercellular space and near the capillary wall of the cecal mucosa were detected at 12 h after MT. This finding suggests that the main reason for the increase in LPS in plasma after MT is cecal mucosal injury. This study is important for the early intervention of the gastrointestinal tract to prevent secondary injury after MT.

Keywords: D-lactate; LPS; gastrointestinal tract; mechanical trauma; mucosal injury.


Conflict of interest statement

The authors declare that the research was conducted in the absence of any commercial or financial relationships that could be construed as a potential conflict of interest.

Figures

FIGURE 1
FIGURE 1
Changes in the gastric mucosa at different times after MT (200×). (A) HE staining of the stomach of the SD rats at different time points after MT. The black area shows obvious vacuolated changes at 6 and 12 h after MT. No obvious changes were observed in the control, 3, 24, and 48 h groups. (B) Mean (±SEM) percentages of morphologically vacuolized areas at 6 and 12 h (***P < 0.001 vs. the control).
FIGURE 2
FIGURE 2
Changes in the ileum mucosa of the SD rats at different times after MT (200×). The morphology of ileum mucosa in all groups of different time points after MT were similar to that in the control group.
FIGURE 3
FIGURE 3
Changes in the cecal mucosa of the SD rats at different time points after MT (200×). (A) HE stainingof cecalmucosa in SD ratsat different time points after MT. The black arrow shows obvious vacuolated changes in 12, 24, and 48 h after MT. No obvious changes were observed in the control, 1.5, 3, and 6 h. (B) Mean (±SEM) percentages of morphologically vacuolizad area at 12, 24, and 48 h (***P < 0.001 vs. the control).
FIGURE 4
FIGURE 4
The morphology of the capillaries and red blood cells in the cecal mucosa of the SD rats at different time points after MT (1,000×). (A) HE staining in the cecal mucosa in SD rats at different time points after MT (1,000×). No obvious changes were observed in the control and 1.5 h. The areas in the black circle showed obvious red cells were found outside the capillaries in the time points of 3, 6, and 12 h after MT. There was obvious vascular wall damage at 24 h after MT. (B) Mean (±SEM) percentages of morphologically red blood areas at 3, 6, 12, and 24 h (***P < 0.001 vs. the control).
FIGURE 5
FIGURE 5
Changes in the microvilli and the cell junctions of cecal mucosa in the SD rats at different time points after MT (12,000×). (A) The black arrow in the figure was referred to the location of the microvilli. The yellow arrow was referred to the location of the cell junction. The areas in the black circle showed obvious vacuolated changes are found at 3 and 12 h. (B) Mean (±SEM) width of cell connections at different time points (***P < 0.001 vs. the control).
FIGURE 6
FIGURE 6
Bacterial structure between cell junctions. The position of the yellow arrows were defined as the cell junction or bacterial structure in the gap. The black square showed the bacterial structure. (a) Enlarged picture under the same vision at 20 min after MT (200,000×).
FIGURE 7
FIGURE 7
Bacterial structure near the capillary wall. The yellow arrow referred to the red cell. The black square referred to cross section structure of bacteria which has a double layer membrane structure. (a) Enlarged picture under the same vision at 12 h after MT (100,000×).
FIGURE 8
FIGURE 8
Changes in the plasma LPS and D-lactate concentrations of the SD rats at different time points after MT. (A) Changes in the plasma LPS concentration of the SD rats at different time points after MT (EU/L). There were statistically significant differences at 20, 45 min, 1.5, 3, 6, 24, and 48 h after MT (*P < 0.05, **P < 0.01 and ***P < 0.001 vs. the control). (B) Changes in the plasma of D-lactate concentration of the SD rats at different time points after MT (μmol/ml). There were statistically significant differences at 20, 45 min, 1.5, 3, 6, 12, and 24 h, after MT (*P < 0.05, **P < 0.01 and ***P < 0.001 vs. the control).
FIGURE 9
FIGURE 9
Macroscopic morphological images of gastrointestinal organs of the SD rats at 20 min and 12 h after MT. The black arrow in the figure was referred to the location of the cecum in vivo. The yellow arrow was referred to the anatomic mucosa of stomach, ileum, cecum and colon.
FIGURE 10
FIGURE 10
Changes of mucosal permeability in intestinal mucosa. (A) Serum concentration of FD-4 in SD rats at 12 h after MT (*P < 0.05 vs. the control). (B) The expression of Occludin at 20 min and 12 h after MT (***P < 0.001 vs. the control).
FIGURE 11
FIGURE 11
The changes of TLR4 in cecal tissue. There were statistically increased at 20 min and 12 h after MT (*P < 0.05 vs. the control).

Similar articles

Cited by

References

    1. Awad W. A., Ghareeb K., Böhm J. (2011). Evaluation of the chicory inulin efficacy on ameliorating the intestinal morphology and modulating the intestinal electrophysiological properties in broiler chickens. J. Anim. Physiol. Anim. Nutr. 95 65–72. 10.1111/j.1439-0396.2010.00999 - DOI - PubMed
    1. Bicakci N., Karaboga I., Dokmeci A. H., Guzel S., Fidanol Erboga Z. (2019). Cardioprotective effect of caffeic acid phenethyl ester on cardiac contusion following blunt chest trauma in rats. Biotech. Histochem. 94 442–448. - PubMed
    1. Cardozo Júnior L. C., Silva R. R. (2014). Sepsis in intensive care unit patients with traumatic brain injury: factors associated with higher mortality. Rev. Bras. Ter. Intensiva 26 148–154. 10.5935/0103-507x.20140022 - DOI - PMC - PubMed
    1. Carpenter K. L., Jalloh I., Hutchinson P. J. (2015). Glycolysis and the significance of lactate in traumatic brain injury. Front. Neurosci. 9:112. 10.3389/fnins.2015.00112 - DOI - PMC - PubMed
    1. Fujimoto T., Imaeda H., Takahashi K., Kasumi E., Bamba S., Fujiyama Y., et al. (2013). Decreased abundance of Faecalibacterium prausnitzii in the gut microbiota of Crohn’s disease. J. Gastroenterol. Hepatol. 28 613–619. 10.1111/jgh.12073 - DOI - PubMed

LinkOut - more resources