. 2021 Apr 16:12:612817.
doi: 10.3389/fneur.2021.612817. eCollection 2021.

An Epigenetically Distinct Subset of Children With Autism Spectrum Disorder Resulting From Differences in Blood Cell Composition

Affiliations

An Epigenetically Distinct Subset of Children With Autism Spectrum Disorder Resulting From Differences in Blood Cell Composition

Maryam Jangjoo et al. Front Neurol. .

Abstract

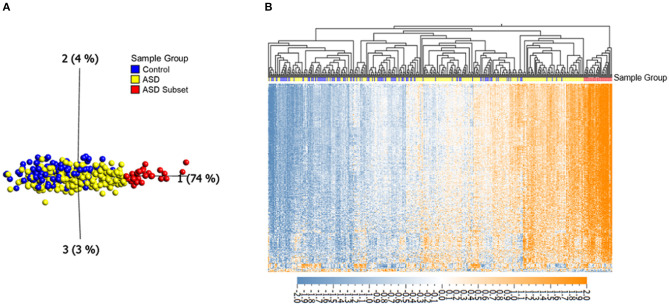
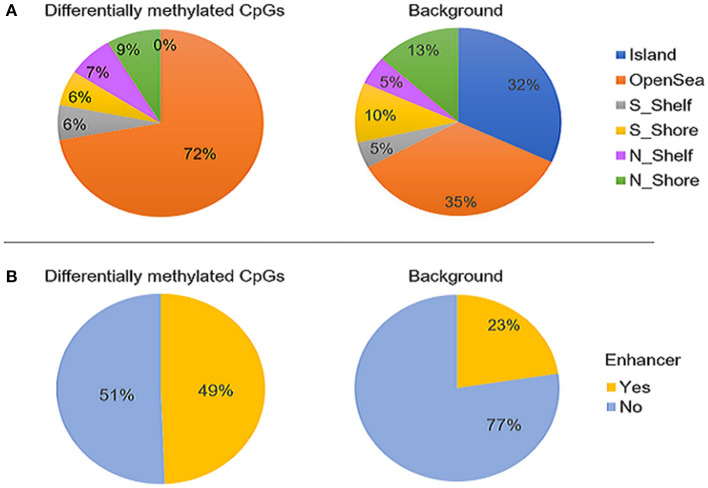
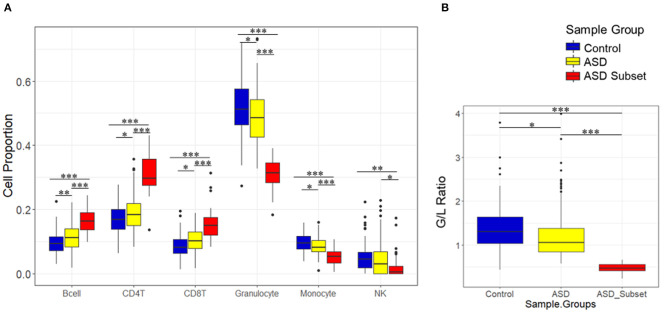
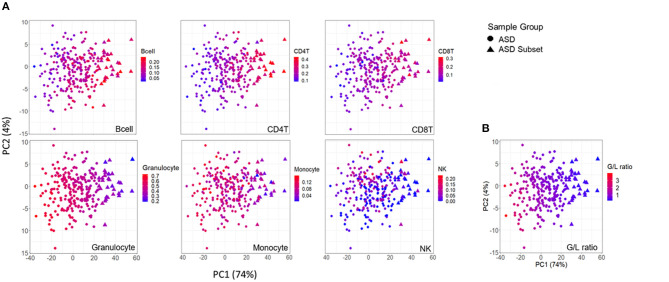
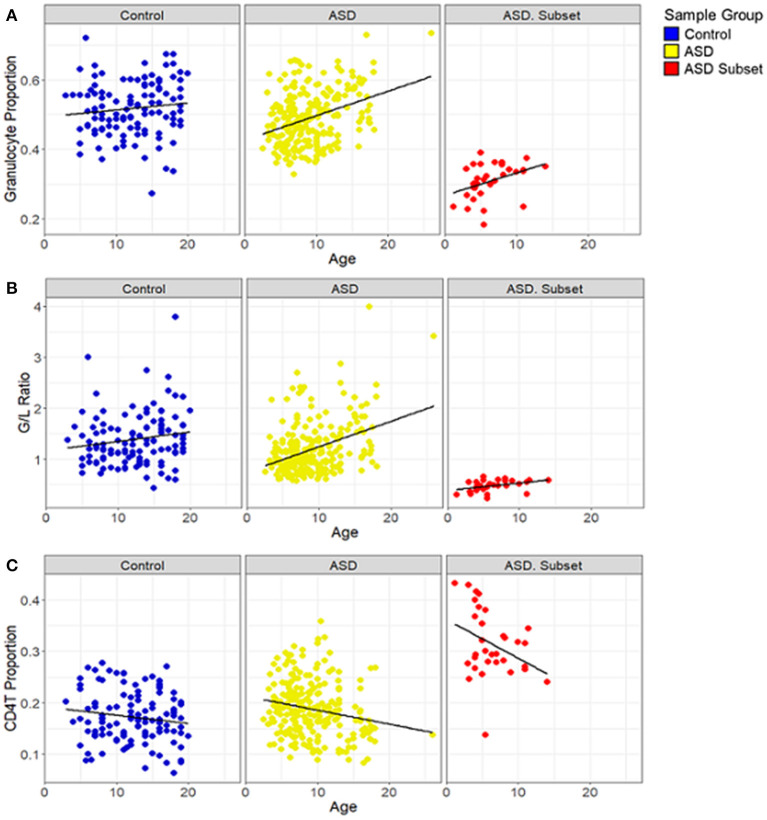
Background: Autism spectrum disorder (ASD) is a complex neurodevelopmental disorder that often involves impaired cognition, communication difficulties and restrictive, repetitive behaviors. ASD is extremely heterogeneous both clinically and etiologically, which represents one of the greatest challenges in studying the molecular underpinnings of ASD. While hundreds of ASD-associated genes have been identified that confer varying degrees of risk, no single gene variant accounts for >1% of ASD cases. Notably, a large number of ASD-risk genes function as epigenetic regulators, indicating potential epigenetic dysregulation in ASD. As such, we compared genome-wide DNA methylation (DNAm) in the blood of children with ASD (n = 265) to samples from age- and sex-matched, neurotypical controls (n = 122) using the Illumina Infinium HumanMethylation450 arrays. Results: While DNAm patterns did not distinctly separate ASD cases from controls, our analysis identified an epigenetically unique subset of ASD cases (n = 32); these individuals exhibited significant differential methylation from both controls than the remaining ASD cases. The CpG sites at which this subset was differentially methylated mapped to known ASD risk genes that encode proteins of the nervous and immune systems. Moreover, the observed DNAm differences were attributable to altered blood cell composition, i.e., lower granulocyte proportion and granulocyte-to-lymphocyte ratio in the ASD subset, as compared to the remaining ASD cases and controls. This ASD subset did not differ from the rest of the ASD cases in the frequency or type of high-risk genomic variants. Conclusion: Within our ASD cohort, we identified a subset of individuals that exhibit differential methylation from both controls and the remaining ASD group tightly associated with shifts in immune cell type proportions. This is an important feature that should be assessed in all epigenetic studies of blood cells in ASD. This finding also builds on past reports of changes in the immune systems of children with ASD, supporting the potential role of altered immunological mechanisms in the complex pathophysiology of ASD. The discovery of significant molecular and immunological features in subgroups of individuals with ASD may allow clinicians to better stratify patients, facilitating personalized interventions and improved outcomes.

Keywords: ASD; DNA methylation; blood cell proportion; epigenetics; granulocytes.


Conflict of interest statement

The authors declare that the research was conducted in the absence of any commercial or financial relationships that could be construed as a potential conflict of interest.

Figures

Figure 1
Figure 1
Differential DNAm at 400 in ASD (n = 265) and neurotypical controls (n = 122) reveals an epigenetically unique subset of ASD cases (n = 32). (A) Principal component analysis performed on 400 CpGs (FDR adjusted p-value < 0.01 and |Δβ| > 5%), with axes representing first three principal components. (B) Corresponding heatmap hierarchical clustering using Eucledian distance metrics. Orange indicates high DNAm, and blue gray indicates low DNAm, normalized for visualization (mean = 0, variance = 1). Samples labeled with red and yellow represent the ASD subset and the remaining ASD cases, respectively, blue samples represent controls.
Figure 2
Figure 2
The genomic distribution of the 400 differentially methylated CpG sites identified between ASD cases (n = 265) and controls (n = 122, left) compared to the background set of all probes that retained after probe filtering (n = 427,137) (right). (A) proportion CpG sites in relation to CpG islands and (B) proportion of CpGs overlapping enhancer regions. The differentially methylated sites were found to be significantly enriched in open sea and enhancers (p-values < 0.05) and depleted in CpG islands (p-value < 0.01). “Island” is CpG island; N_shore and S_shore are north (upstream) and south (downstream) shores, i.e. 2kb regions flanking island; N_shelf and S_shelf are north (upstream) and south (downstream) shelves, i.e. 2kb regions flanking island shores.
Figure 3
Figure 3
Relative proportions of blood cell types in sample groups, as estimated by DNAm. Boxplots show immune blood cell proportions estimated by the Houseman method (A) and calculated granulocyte/lymphocyte (G/L) ratio (B). Epigenetically unique ASD subset (red; n = 32), the remaining ASD cases (yellow; n = 233), and controls (blue; n = 122). ASD subset exhibited significant shifts in cell type proportions and the G/L ratio (p-value < 0.01) as compared to the remaining ASD cases and controls. Black bars with asterisk represent significant differences in estimated blood cell proportions between the groups (*p ≤ 0.05; **p ≤ 0.01; ***p ≤ 0.001).
Figure 4
Figure 4
Association between DNAm variation and cell type proportions across ASD cases. Scatterplots of first two principal components from principal component analysis (PCA) performed on 400 differentially methylated sites between ASD cases (n = 265), and controls (n = 122). (A) distribution of blood cell proportions [from left to right: B cells, CD4T cells, CD8T cells, granulocytes, monocytes and natural killer cells (NK)] and (B) granulocyte/lymphocyte (G/L) ratio across ASD cases. Samples plotted as triangles represent distinct ASD subset (n = 32) and circles represent remaining ASD cases (n = 233). Color of point indicates proportion of given cell type in each sample.
Figure 5
Figure 5
Relationship between blood cell proportions and sample age in individuals with ASD. Box plots depict (A) granulocyte proportion, (B) granulocyte/lymphocyte (G/L) ratio and (C) CD4T proportion in samples plotted against age. ASD subset (red; n = 32), the remaining ASD cases (yellow; n = 233), and controls (blue; n = 122). In all both ASD groups, age was positively correlated with the granulocyte proportion (ASD subset: r = 0.43, p-value = 0.01; the remaining ASD: r = 0.35, p-value < 0.001) and the G/L ratio (ASD subset: r = 0.45, p-value = 0.01; the remaining ASD: r = 0.37, p-value < 0.001) and negatively correlated with CD4T (ASD subset: r = −0.4, p-value = 0.02; the remaining ASD: r = −0.2, p-value = 0.002); the remaining ASD: r = −0.2, p-value = 0.002). In controls, no significant correlation was found between age and the blood cell compositions.

Similar articles

Cited by

References

    1. Martin G. Diagnostic and statistical manual of mental disorders: DSM-5 (5th edition). Ref Rev. (2014) 28:36–7. 10.1108/RR-10-2013-0256 - DOI - PubMed
    1. Bridgemohan C, Cochran DM, Howe YJ, Pawlowski K, Zimmerman AW, Anderson GM, et al. . Investigating potential biomarkers in autism spectrum disorder. Front Integr Neurosci. (2019) 13:31. 10.3389/fnint.2019.00031 - DOI - PMC - PubMed
    1. Veenstra-VanderWeele J, Blakely RD. Networking in autism: leveraging genetic, biomarker and model system findings in the search for new treatments. Neuropsychopharmacology. (2012) 37:196–212. 10.1038/npp.2011.185 - DOI - PMC - PubMed
    1. Ruggeri B, Sarkans U, Schumann G, Persico AM. Biomarkers in autism spectrum disorder: the old and the new. Psychopharmacology. (2014) 231:1201–16. 10.1007/s00213-013-3290-7 - DOI - PubMed
    1. C Yuen RK, Merico D, Bookman M, L Howe J, Thiruvahindrapuram B, Patel RV, et al. . Whole genome sequencing resource identifies 18 new candidate genes for autism spectrum disorder. Nature neuroscience. (2017) 20:602–11. 10.1038/nn.4524 - DOI - PMC - PubMed