Review
. 2021 Apr 14:12:654201.
doi: 10.3389/fimmu.2021.654201. eCollection 2021.

The Mechanism of Action of Antigen Processing Independent T Cell Epitopes Designed for Immunotherapy of Autoimmune Diseases

Affiliations
Review

The Mechanism of Action of Antigen Processing Independent T Cell Epitopes Designed for Immunotherapy of Autoimmune Diseases

Ella R Shepard et al. Front Immunol. .

Abstract

Immunotherapy with antigen-processing independent T cell epitopes (apitopes) targeting autoreactive CD4+ T cells has translated to the clinic and been shown to modulate progression of both Graves' disease and multiple sclerosis. The model apitope (Ac1-9[4Y]) renders antigen-specific T cells anergic while repeated administration induces both Tr1 and Foxp3+ regulatory cells. Here we address why CD4+ T cell epitopes should be designed as apitopes to induce tolerance and define the antigen presenting cells that they target in vivo. Furthermore, we reveal the impact of treatment with apitopes on CD4+ T cell signaling, the generation of IL-10-secreting regulatory cells and the systemic migration of these cells. Taken together these findings reveal how apitopes induce tolerance and thereby mediate antigen-specific immunotherapy of autoimmune diseases.

Keywords: Tr1 cell; apitope; autoimmune disease; dendritic cell; immunological tolerance; immunotherapy; interleukin-10; synthetic peptide.


Conflict of interest statement

DW is Professor of Immunology at the University of Birmingham and CSO and Founder of Apitope International NV; ES, BH and LJ are or were recent employees of Apitope International NV. The remaining authors declare that the research was conducted in the absence of any commercial or financial relationships that could be construed as a potential conflict of interest.

Figures

Figure 1
Figure 1
Soluble peptide epitopes target steady-state DC in vivo: B10.PL mice received a SC injection of 80µg 4Y or PBS alone (not shown). After 2h, splenic APC populations were enriched by FACS. (A) sorted APCs were cultured in a 96-well plate at 5x10⁴ per well with equal numbers of CD4+ T cells isolated from an untreated Tg4 mouse. Open bars represent cells from mice that received 80µg MBP Ac1-9[4Y] SC, filled bars show proliferation of cultures with 4Y added in vitro (1µg/ml). Proliferation was measured by tritiated thymidine (3H-TdR) incorporation at d3. Graphs show mean of triplicate wells and error bars show SEM. (B) as (A); however, CD11c+ DC from mice treated with 4Y or PBS alone were fractionated by FACS into major subsets before culture with Tg4 CD4+ T cells. (C) protocol for cell transfer experiments. (D) 4Y–DC (x3) and PBS–DC (x3) group received three transfers of 1x10⁶ CD11c+ DCs from mice pre-treated with 4Y or PBS respectively on days 0, 5 and 10. 4Y–DC (x1) received MBP Ac1-9[4Y]-loaded DCs on day 10 only. Splenocytes from individual mice were cultured at 2.5x10⁶/ml with Ac1-9[4K] for 72 hours, proliferation was measured by tritiated thymidine (3H-TdR) incorporation. Graph shows mean of four repeat wells per mouse (n=2 mice per group), error bars show SEM (*p ≤ 0.05, **p ≤ 0.01, ***p ≤ 0.001, ****p ≤ 0.0001). (E) graphs of % of IL-2, IFN-γ and IL-10 expressing cells following ICCS staining protocol. Data represents mean value for two samples per treatment group, error bars = SEM, n.s. = not significant.
Figure 2
Figure 2
Peptide solubility predicts accessibility to steady state DC and determines tolerance induction: The 4Y peptide was rendered increasingly insoluble by addition of LF motifs. Aggregation index (AI) calculated by the formula AI = 100 x (Abs340/(Abs280-Abs340). All bars show the mean and SEM of eight repeat measurements taken in a single experiment. (A) peptides with 2-3 LF motifs were increasingly aggregated but remained antigenic (B) as evidenced by tritiated thymidine (3H-TdR) incorporation at d3 after addition to Tg4 splenocytes (2x10⁵ per well) in vitro. (C) shows cell proliferation of Tg4 CD4+ T cells simulated in vitro with CD11c+ cells purified from mice treated with 80µg 4Y or 4Y-3LF SC, as in Figure 1A . (D) Tg4 mice received escalating doses (see Figure 3E ) of 4Y (filled circle), 4Y-3LF (filled inverted triangle), or PBS (open square) injections SC every 3-4 days. Inguinal and brachial lymph nodes were isolated three days following the sixth dose and cultured at 5x10⁴ cells per well in a 96–well plate with Ac1–9[4K]. Proliferation was measured by tritiated thymidine (3H-TdR) incorporation at 72 hours. Using the same conditions as in (D), (E) analyses the response of 5x10⁴ splenocytes per well without IL-2 or following addition of exogenous rhIL-2 at 20 U/ml (F). Graphs show mean of triplicate wells and error bars show SEM (*p ≤ 0.05, **p ≤ 0.01, ***p ≤ 0.001, ****p ≤ 0.0001).
Figure 3
Figure 3
Impact of soluble versus insoluble peptide treatment on T cell function in Tg4 mice. A single SC dose of soluble 4Y (80µg) induces rapid and high levels of IL-2 into the serum of Tg4 mice (A) when compared to insoluble 4Y-3LF (B). For the data shown in (C), Tg4 mice received a SC injection of 80µg MBP Ac1-9[4Y] or 4Y-3LF. Blood was removed from the tail vein at the specified times following injection, baseline was taken prior to peptide injection and the cellular fraction was stained for flow cytometry. Inguinal lymph node (ILN), brachial lymph node (BLN) and spleen were collected at 48–hours. Percentages of CD4+ cells were gated on live singlets. Dose escalation of 4Y peptide given SC using the protocol shown in (3E) induced high levels of IL-10 secretion into blood (D) that was not seen in mice treated with 4Y-3LF (open bars = 4Y; filled bars = 4Y-3LF), error bars show SEM. (*p ≤ 0.05, **p ≤ 0.01, ***p ≤ 0.001, ****p ≤ 0.0001). (E) shows the dose escalation protocol used for tolerance induction in (D). Tg4 mice were given SC injections of PBS containing the indicated doses of 4Y peptide given every 3rd or 4th day (2 doses per week).
Figure 4
Figure 4
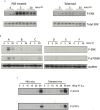
Impact of peptide induced tolerance induction on cell signaling (A) CD4+ T cells were enriched from spleens of naïve (PBS treated) versus tolerized Tg4 mice at the indicated times following challenge with 80µg MBP Ac1-9[4Y] SC, cell extracts prepared and Western blots stained for either phospho-ERK or total ERK protein. (B) CD4+ T cells collected at the indicated time after Tg4 mice were tolerized by dose escalation as shown in Figure 3E . Western blots were stained for phosphor-ERK and phosphor-p70S6K using GAPDH as loading control. (C) CD4+ T cells were enriched from spleens of naïve versus tolerized Tg4 mice at the indicated times following challenge with 80µg MBP Ac1-9[4Y] SC, cell extracts prepared and Western blots stained for either phospho-STAT3 or phospho-STAT5.
Figure 5
Figure 5
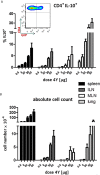
IL-10 production in tiger-Tg4 mice during dose escalation immunotherapy. Tg4GFP/IL10 mice were treated with 4Y according to the dose escalation protocol in Figure 3E . Different organs were isolated from 6 mice over 2 independent experiments (ILN=inguinal lymph nodes; MLN=mediastinal LN). The inset shows a representative cytometry plot from a spleen after the last dose of 4Y gated on live single CD4+ T cells. Bar graphs show mean ± SEM. (A) represents % of GFP+ cells among gated CD4+ cells whereas (B) shows the absolute number of GFP+ IL-10 producing CD4+ cells.
Figure 6
Figure 6
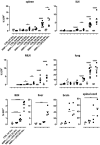
Distribution of IL-10 producing CD4+ T cells during the course of tolerization. tiger-Tg4 mice were treated with 4Y peptide by dose escalation as shown in Figure 3E . Two hours after the indicated dose animals were perfused with PBS and organs were isolated. After gating on viable, single CD4+ T cells, IL-10+ T cells were investigated by flow cytometry. Horizontal lines indicate the mean (*p ≤ 0.05, **p ≤ 0.01, ***p ≤ 0.001, ****p ≤ 0.0001). In the spleen, ILN (inguinal lymph nodes), MLN (mediastinal LN), lung and BLN (brachial LN) each dot represents one individual. In the liver, in some cases cells from two animals were combined due to low cell numbers while in the CNS compartment each dot represents two individuals.
Figure 7
Figure 7
Distribution of CD4+ T cells in EAE after tolerization. Tg4 mice were treated with PBS or 4Y by dose escalation ( Figure 5A ) before the induction of EAE with their cognate peptide in CFA, and pertussis toxin given on days 0 and 2. Animals were analyzed at the peak of disease when mice treated with PBS showed complete hind limb paralysis (grade 3) and EDI-treated animals showed no sign of disease. Gated on single cells. Horizontal lines indicate mean (*p ≤ 0.05, **p ≤ 0.01, ***p ≤ 0.001, ****p ≤ 0.0001). Each dot represents one individual.

References

    1. Wraith DC. Designing antigens for the prevention and treatment of autoimmune diseases. Curr Opin Chem Eng (2018) 19:35–42. 10.1016/j.coche.2017.12.004 - DOI
    1. Krienke C, Kolb L, Diken E, Streuber M, Kirchhoff S, Bukur T, et al. . A noninflammatory mRNA vaccine for treatment of experimental autoimmune encephalomyelitis. Science (2021) 371(6525):145–53. 10.1126/science.aay3638 - DOI - PubMed
    1. Sabatos-Peyton CA, Verhagen J, Wraith DC. Antigen-specific immunotherapy of autoimmune and allergic diseases. Curr Opin Immunol (2010) 22(5):609–15. 10.1016/j.coi.2010.08.006 - DOI - PMC - PubMed
    1. Anderton SM, Viner NJ, Matharu P, Lowrey PA, Wraith DC. Influence of a dominant cryptic epitope on autoimmune T cell tolerance. Nat Immunol (2002) 3(2):175–81. 10.1038/ni756 - DOI - PubMed
    1. Shen CR, Youssef AR, Devine A, Bowie L, Hall AM, Wraith DC, et al. . Peptides containing a dominant T-cell epitope from red cell band 3 have in vivo immunomodulatory properties in NZB mice with autoimmune hemolytic anemia. Blood (2003) 102(10):3800–6. 10.1182/blood-2002-07-2125 - DOI - PubMed

Publication types