

High Dimensional Imaging Mass Cytometry Panel to Visualize the Tumor Immune Microenvironment Contexture
- PMID: 33936105
- PMCID: PMC8085494
- DOI: 10.3389/fimmu.2021.666233
High Dimensional Imaging Mass Cytometry Panel to Visualize the Tumor Immune Microenvironment Contexture
Abstract
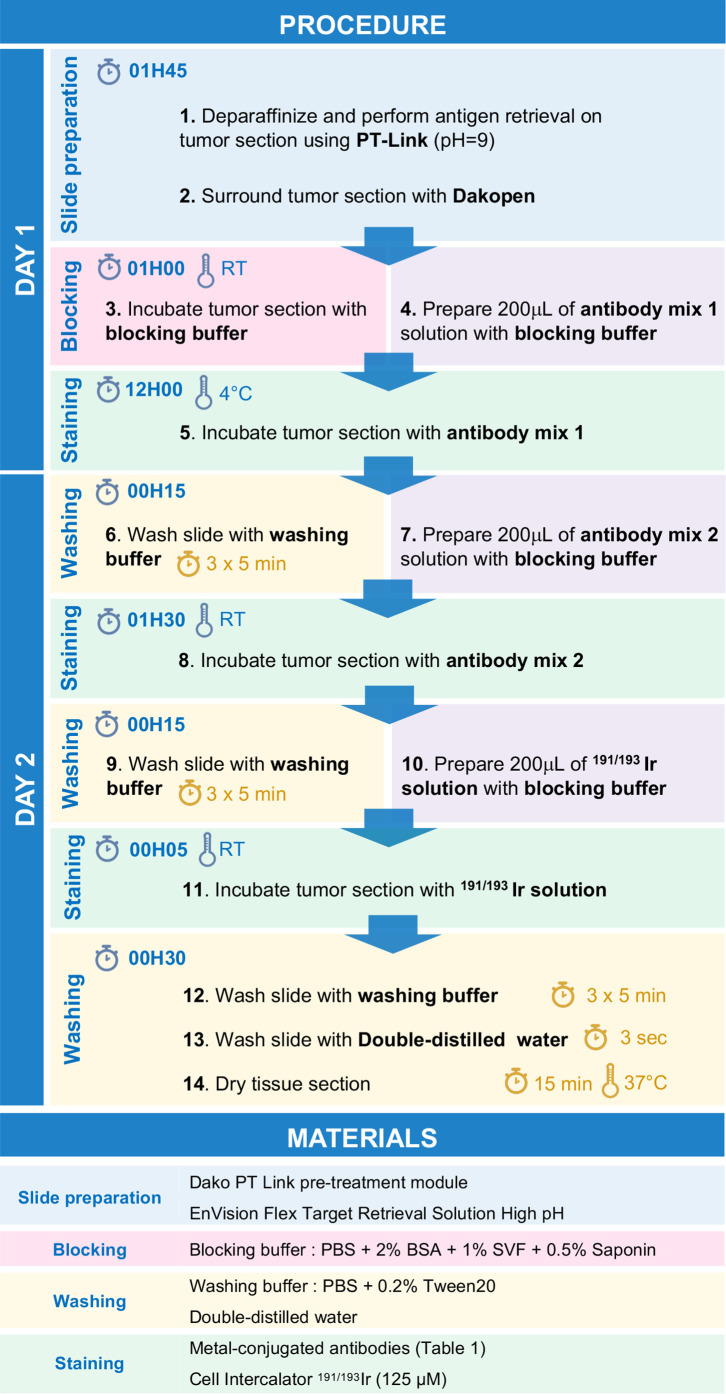
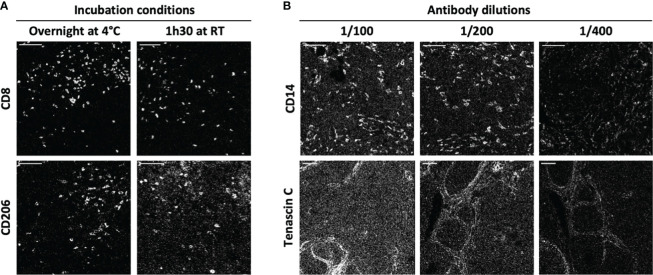
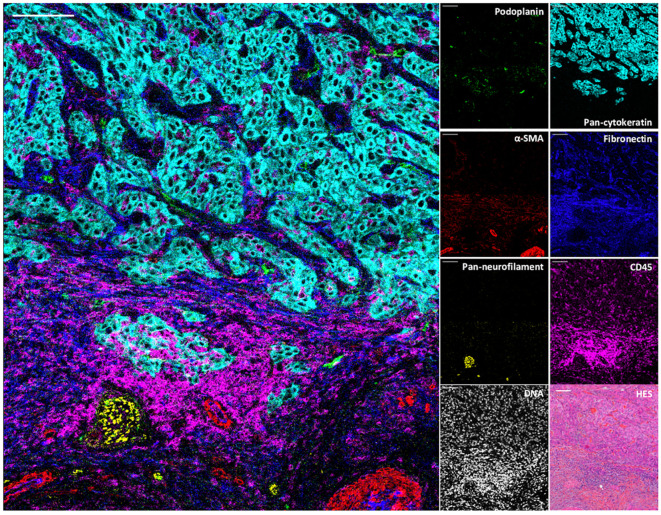
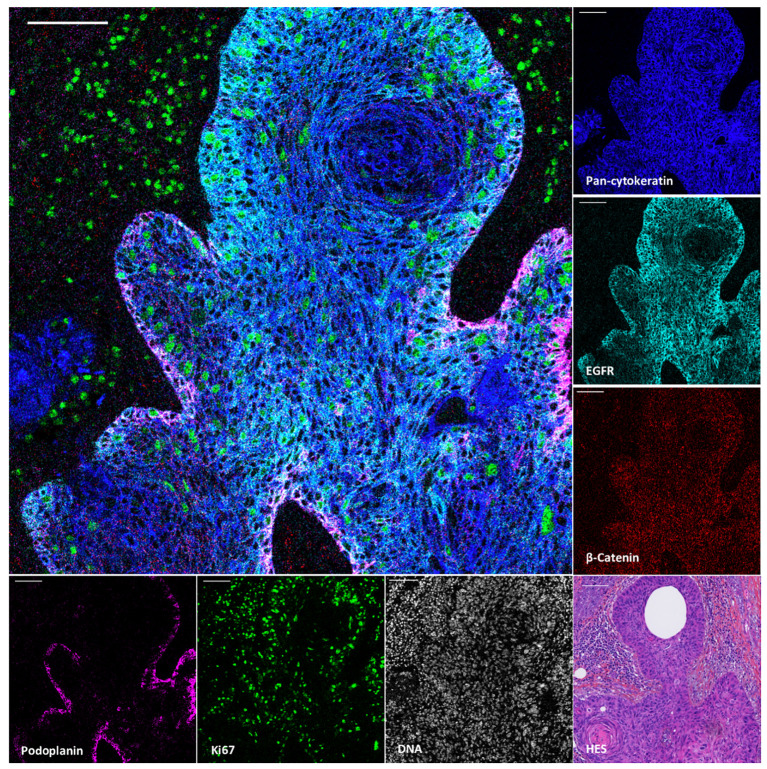
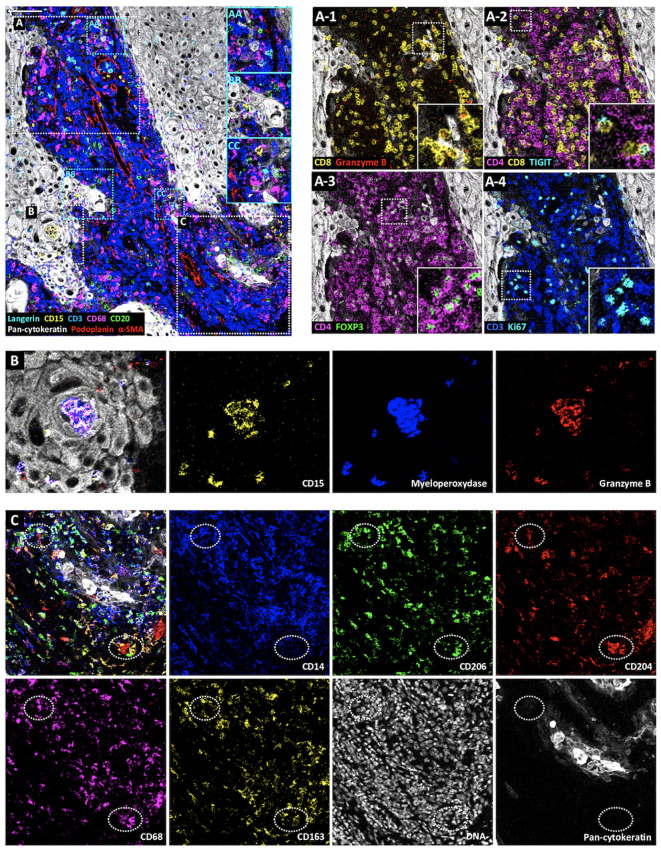
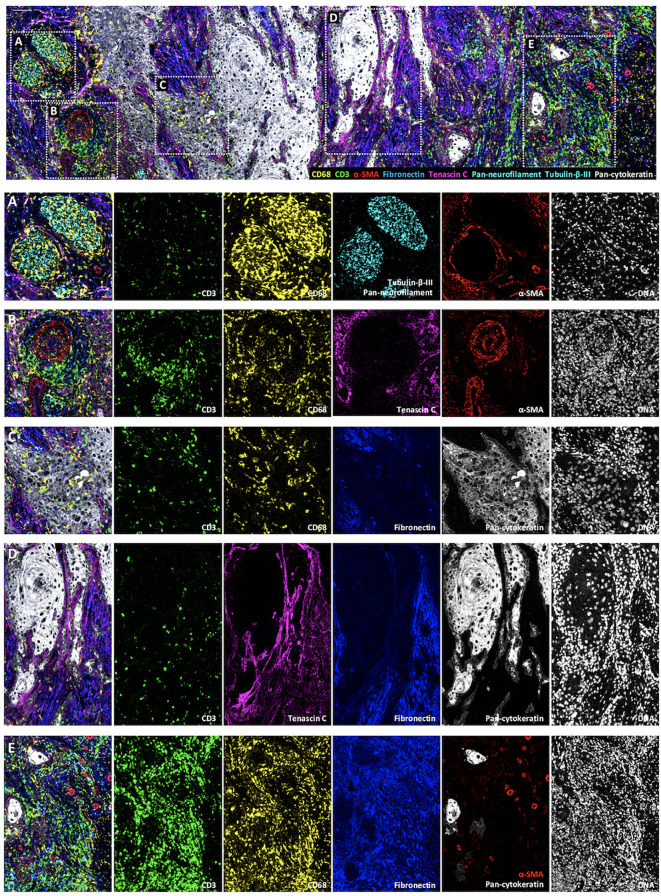
The integrative analysis of tumor immune microenvironment (TiME) components, their interactions and their microanatomical distribution is mandatory to better understand tumor progression. Imaging Mass Cytometry (IMC) is a high dimensional tissue imaging system which allows the comprehensive and multiparametric in situ exploration of tumor microenvironments at a single cell level. We describe here the design of a 39-antibody IMC panel for the staining of formalin-fixed paraffin-embedded human tumor sections. We also provide an optimized staining procedure and details of the experimental workflow. This panel deciphers the nature of immune cells, their functions and their interactions with tumor cells and cancer-associated fibroblasts as well as with other TiME structural components known to be associated with tumor progression like nerve fibers and tumor extracellular matrix proteins. This panel represents a valuable innovative and powerful tool for fundamental and clinical studies that could be used for the identification of prognostic biomarkers and mechanisms of resistance to current immunotherapies.
Keywords: biomarkers; imaging mass cytometry; immune therapies; panel design; tumor immune microenvironment.
Copyright © 2021 Elaldi, Hemon, Petti, Cosson, Desrues, Sudaka, Poissonnet, Van Obberghen-Schilling, Pers, Braud, Anjuère and Meghraoui-Kheddar.
Conflict of interest statement
The authors declare that the research was conducted in the absence of any commercial or financial relationships that could be construed as a potential conflict of interest.
Figures
Similar articles
-
A 40-Marker Panel for High Dimensional Characterization of Cancer Immune Microenvironments by Imaging Mass Cytometry.Front Immunol. 2019 Oct 29;10:2534. doi: 10.3389/fimmu.2019.02534. eCollection 2019. Front Immunol. 2019. PMID: 31736961 Free PMC article.
-
From surfing to diving into the tumor microenvironment through multiparametric imaging mass cytometry.Front Immunol. 2025 Apr 11;16:1544844. doi: 10.3389/fimmu.2025.1544844. eCollection 2025. Front Immunol. 2025. PMID: 40292277 Free PMC article. Review.
-
Development of 42 marker panel for in-depth study of cancer associated fibroblast niches in breast cancer using imaging mass cytometry.Front Immunol. 2024 Apr 22;15:1325191. doi: 10.3389/fimmu.2024.1325191. eCollection 2024. Front Immunol. 2024. PMID: 38711512 Free PMC article.
-
Development of a high dimensional imaging mass cytometry panel to investigate spatial organization of tissue microenvironment in formalin-fixed archival clinical tissues.Heliyon. 2024 May 14;10(10):e31191. doi: 10.1016/j.heliyon.2024.e31191. eCollection 2024 May 30. Heliyon. 2024. PMID: 38803925 Free PMC article.
-
Single-cell high-dimensional imaging mass cytometry: one step beyond in oncology.Semin Immunopathol. 2023 Jan;45(1):17-28. doi: 10.1007/s00281-022-00978-w. Epub 2023 Jan 4. Semin Immunopathol. 2023. PMID: 36598557 Free PMC article. Review.
Cited by
-
Immuno Tomography (IT) and Imaging Mass Cytometry (IMC) for constructing spatially resolved, multiplexed 3D IMC data sets.Ocul Surf. 2022 Jul;25:49-54. doi: 10.1016/j.jtos.2022.04.008. Epub 2022 Apr 28. Ocul Surf. 2022. PMID: 35489589 Free PMC article.
-
Challenges and Opportunities for Immunoprofiling Using a Spatial High-Plex Technology: The NanoString GeoMx® Digital Spatial Profiler.Front Oncol. 2022 Jun 29;12:890410. doi: 10.3389/fonc.2022.890410. eCollection 2022. Front Oncol. 2022. PMID: 35847846 Free PMC article. Review.
-
Different approaches to Imaging Mass Cytometry data analysis.Bioinform Adv. 2023 Apr 3;3(1):vbad046. doi: 10.1093/bioadv/vbad046. eCollection 2023. Bioinform Adv. 2023. PMID: 37092034 Free PMC article. Review.
-
Systems immunology integrates the complex endotypes of recessive dystrophic epidermolysis bullosa.Nat Commun. 2025 Jan 14;16(1):664. doi: 10.1038/s41467-025-55934-7. Nat Commun. 2025. PMID: 39809737 Free PMC article.
-
Spatially variant immune infiltration scoring in human cancer tissues.NPJ Precis Oncol. 2022 Sep 1;6(1):60. doi: 10.1038/s41698-022-00305-4. NPJ Precis Oncol. 2022. PMID: 36050391 Free PMC article.
References
Publication types
MeSH terms
Substances
LinkOut - more resources
Full Text Sources
Other Literature Sources