

Interrelation of inflammation and oxidative stress in liver cirrhosis
- PMID: 33936259
- PMCID: PMC8082585
- DOI: 10.3892/etm.2021.10034
Interrelation of inflammation and oxidative stress in liver cirrhosis
Abstract
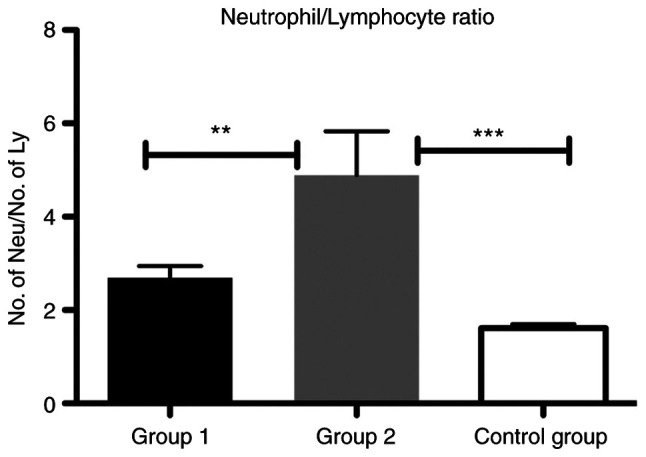
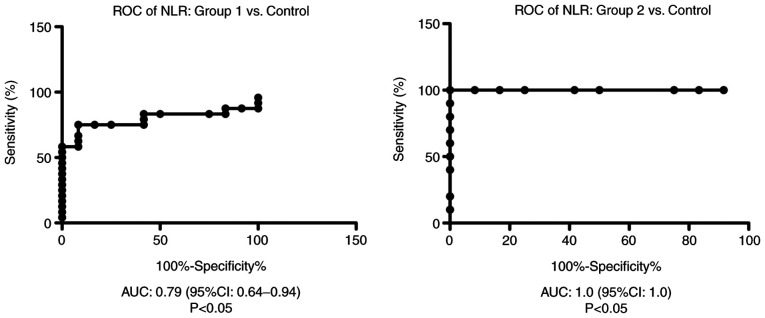
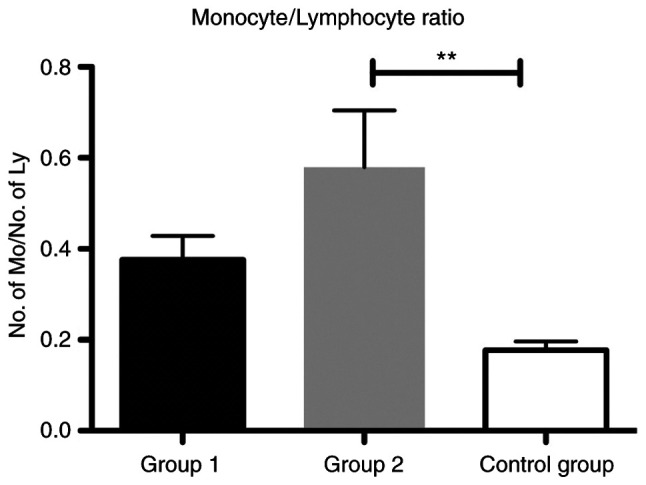
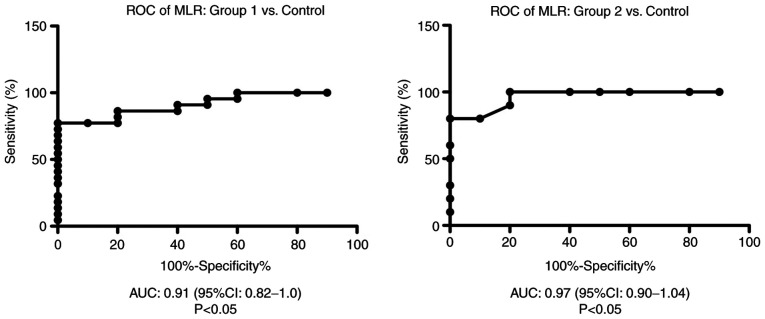
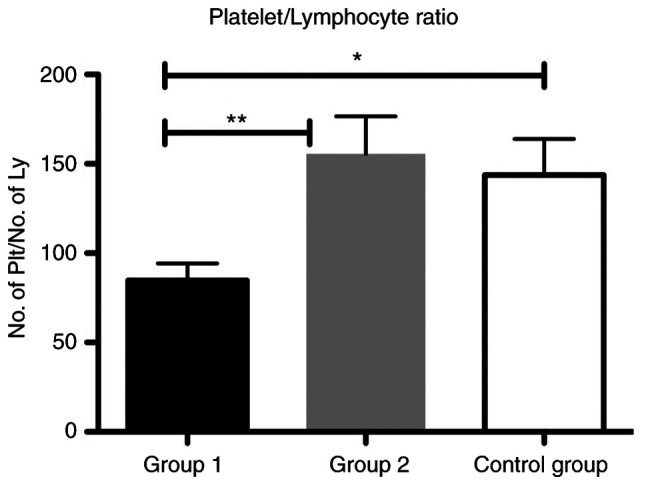
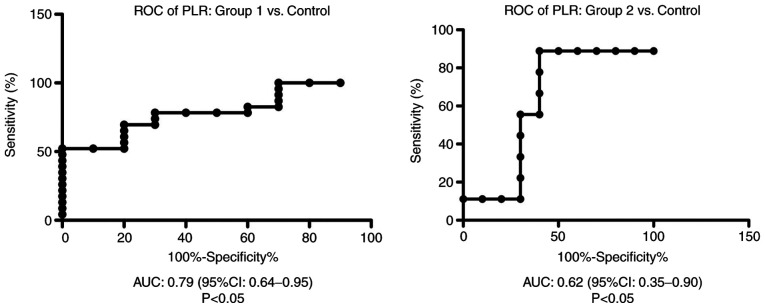
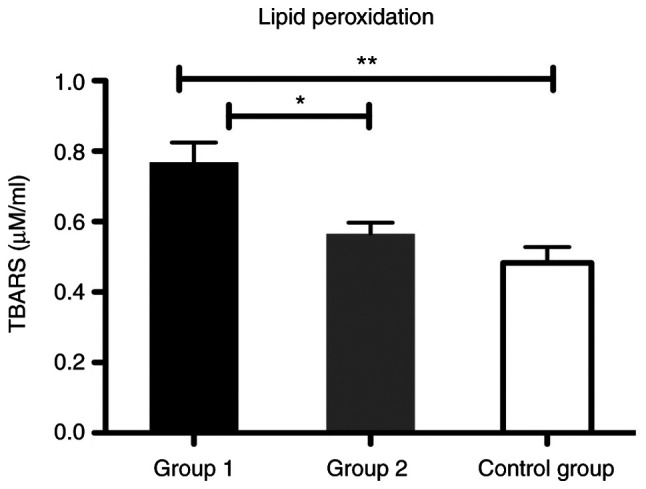
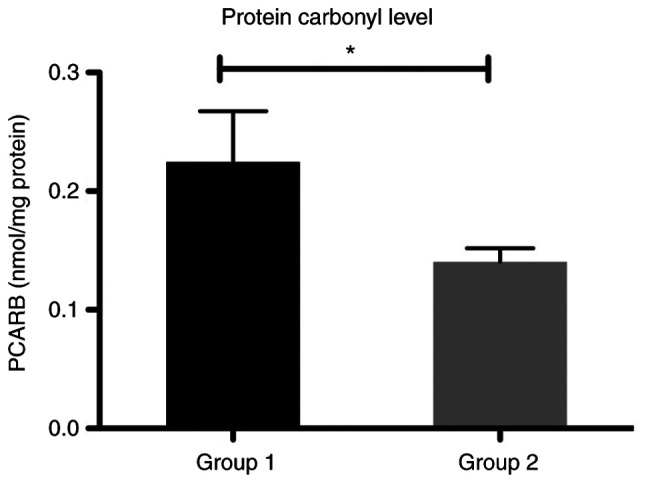
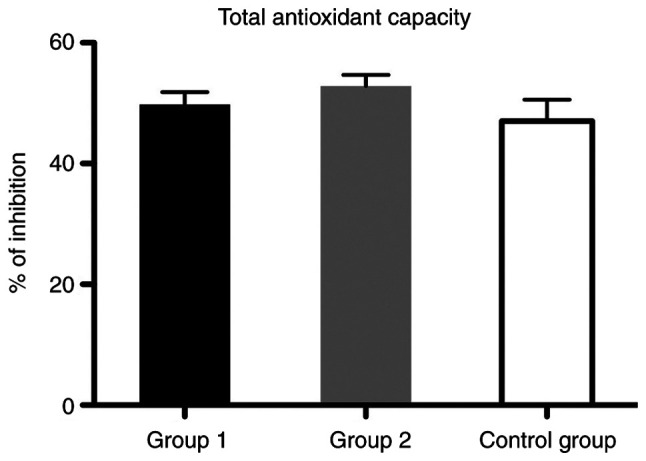
Recently, the trend of research has been focused on the role of hematological indicators in assessing the activities of various diseases. The aim of the present study was to determine the usefulness of such hematological indicators for assessment of the relationship between inflammation and oxidative stress in order to provide new predictive tools for a non-invasive investigation of disease outcome for liver cirrhosis patients. A total of 35 subjects with compensated or decompensated liver cirrhosis and 10 age-matched healthy volunteers were included in this study. The patients were divided into two groups: Group 1, patients with toxic metabolic cirrhosis due to ethanol consumption; group 2, patients with liver cirrhosis following hepatitis B virus (HBV) and hepatitis C virus (HCV) infection. Using hematological data obtained after the complete counting of peripheral blood cells, the monocyte/lymphocyte (MLR), neutrophil/lymphocyte (NLR) and platelet/lymphocyte (PLR) ratios as well as systemic immune inflammation biomarkers were determined. The erythrocyte sedimentation ratio (ESR), C-reactive protein (CRP), fibrinogen and biochemical parameters related to liver function were also registered. Thiobarbituric acid reactive substances (TBARS), protein carbonyl content (PCARB), and total antioxidant capacity (TAC) were also investigated in the peripheral blood samples of healthy subjects and liver cirrhosis patients. The results revealed that NLR, MLR and PLR were significantly increased in group 2. PLR was significantly increased in group 1 compared with that noted in the control group. TBARS and PCARB were increased in patients from group 1 compared to patients from group 2 and the control group. However, no difference in TAC was found between the liver cirrhosis groups and the control. We showed that the pro-inflammatory status of liver cirrhosis patients can be easily appreciated by NLR, MLR but not PLR. However, the increase in these ratios was not significantly associated with a decrease in the antioxidant capacity and an augmentation of oxidative stress markers for the patients diagnosed with cirrhosis included in the two groups of study.
Keywords: inflammation; liver cirrhosis; monocyte/lymphocyte ratio; neutrophil/lymphocyte ratio; oxidative stress; platelet/lymphocyte ratio.
Copyright: © Pomacu et al.
Conflict of interest statement
The authors declare that they have no competing interests.
Figures
Similar articles
-
Diagnostic value of blood parameters for community-acquired pneumonia.Int Immunopharmacol. 2018 Nov;64:10-15. doi: 10.1016/j.intimp.2018.08.022. Epub 2018 Aug 23. Int Immunopharmacol. 2018. PMID: 30144639
-
Association of simple hematological parameters with disease manifestations, activity, and severity in patients with systemic sclerosis.Clin Rheumatol. 2020 Jan;39(1):77-83. doi: 10.1007/s10067-019-04685-0. Epub 2019 Jul 18. Clin Rheumatol. 2020. PMID: 31317426
-
Platelet-to-lymphocyte ratio (PLR) and neutrophil-to-lymphocyte ratio (NLR) are associated with chronic hepatitis B virus (HBV) infection.Int Immunopharmacol. 2017 Oct;51:1-8. doi: 10.1016/j.intimp.2017.07.007. Epub 2017 Jul 28. Int Immunopharmacol. 2017. PMID: 28759808
-
Neutrophil/lymphocyte ratio and platelet/lymphocyte ratio in mood disorders: A meta-analysis.Prog Neuropsychopharmacol Biol Psychiatry. 2018 Jun 8;84(Pt A):229-236. doi: 10.1016/j.pnpbp.2018.03.012. Epub 2018 Mar 10. Prog Neuropsychopharmacol Biol Psychiatry. 2018. PMID: 29535038
-
Neutrophil-lymphocyte ratio, monocyte-lymphocyte ratio and platelet-lymphocyte ratio in non-affective psychosis: A meta-analysis and systematic review.World J Biol Psychiatry. 2020 Jun;21(5):326-338. doi: 10.1080/15622975.2019.1583371. Epub 2019 Apr 30. World J Biol Psychiatry. 2020. PMID: 30806142
Cited by
-
Hepatoprotective Effects of a Natural Flavanol 3,3'-Diindolylmethane against CCl4-Induced Chronic Liver Injury in Mice and TGFβ1-Induced EMT in Mouse Hepatocytes via Activation of Nrf2 Cascade.Int J Mol Sci. 2022 Sep 27;23(19):11407. doi: 10.3390/ijms231911407. Int J Mol Sci. 2022. PMID: 36232707 Free PMC article.
-
The HCV-Melanoma Paradox: First Multi-Cohort and Molecular Net-Work Analysis Reveals Lower Incidence but Worse Outcomes-Integrating Clinical, Real-World, and In Silico Data.Medicina (Kaunas). 2024 Sep 19;60(9):1531. doi: 10.3390/medicina60091531. Medicina (Kaunas). 2024. PMID: 39336572 Free PMC article.
-
Oxidative Stress and Antioxidant Defense Mechanisms in Acute Ischemic Stroke Patients with Concurrent COVID-19 Infection.Int J Mol Sci. 2023 Nov 27;24(23):16790. doi: 10.3390/ijms242316790. Int J Mol Sci. 2023. PMID: 38069113 Free PMC article.
-
Bioinformatics Analysis of Common Genetic and Molecular Traits and Association of Portal Hypertension with Pulmonary Hypertension.J Healthc Eng. 2022 Oct 20;2022:9237701. doi: 10.1155/2022/9237701. eCollection 2022. J Healthc Eng. 2022. PMID: 36312597 Free PMC article.
-
Carvacrol prevents acrylamide-induced oxidative and inflammatory liver damage and dysfunction in rats.Front Pharmacol. 2023 Apr 5;14:1161448. doi: 10.3389/fphar.2023.1161448. eCollection 2023. Front Pharmacol. 2023. PMID: 37089925 Free PMC article.
References
LinkOut - more resources
Full Text Sources
Other Literature Sources
Research Materials
Miscellaneous