

Quantifying the concentration dependence of sedimentation coefficients for globular macromolecules: a continuing age-old problem
- PMID: 33936319
- PMCID: PMC8046895
- DOI: 10.1007/s12551-021-00793-x
Quantifying the concentration dependence of sedimentation coefficients for globular macromolecules: a continuing age-old problem
Abstract
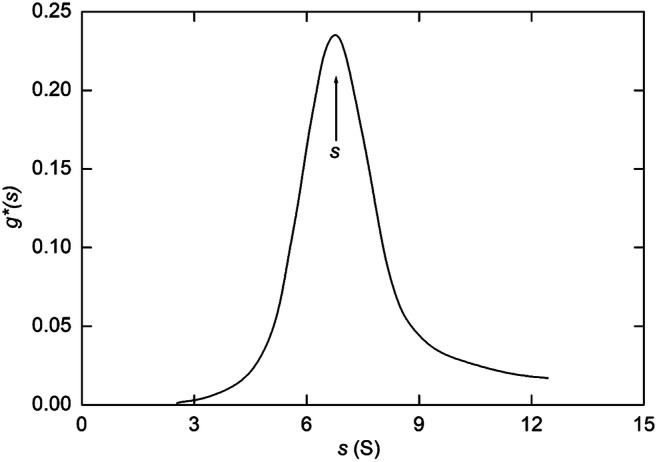
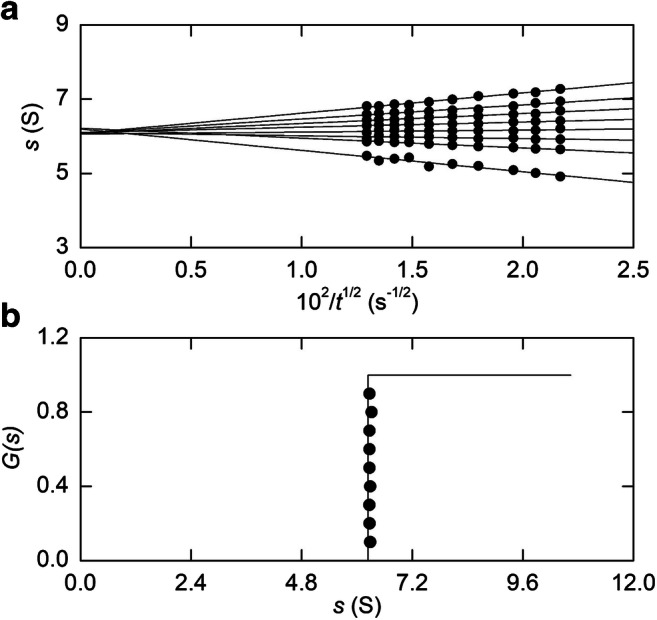
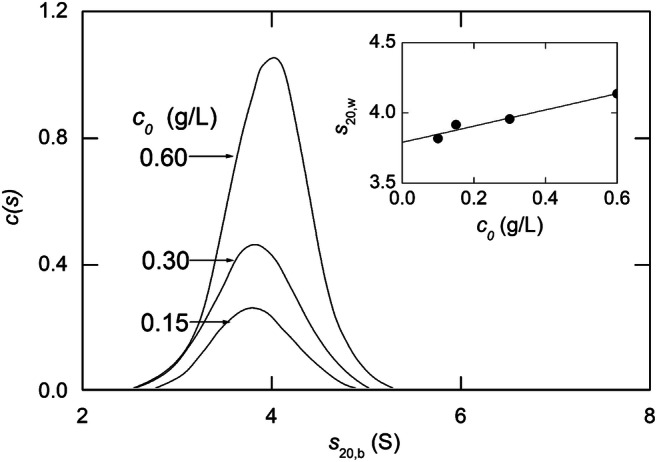
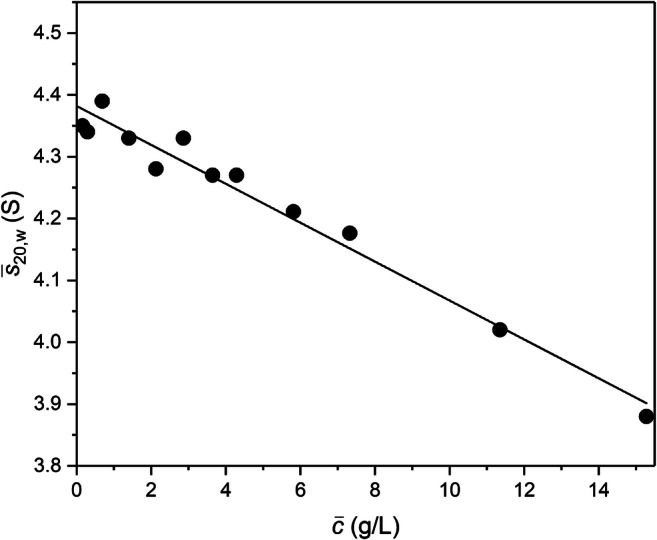
This retrospective investigation has established that the early theoretical attempts to directly incorporate the consequences of radial dilution into expressions for variation of the sedimentation coefficient as a function of the loading concentration in sedimentation velocity experiments require concentration distributions exhibiting far greater precision than that achieved by the optical systems of past and current analytical ultracentrifuges. In terms of current methods of sedimentation coefficient measurement, until such improvement is made, the simplest procedure for quantifying linear s-c dependence (or linear concentration dependence of 1/s) for dilute systems therefore entails consideration of the sedimentation coefficient obtained by standard c(s), g*(s) or G(s) analysis) as an average parameter ( ) that pertains to the corresponding mean plateau concentration (following radial dilution) ( ) over the range of sedimentation velocity distributions used for the determination of . The relation of this with current descriptions of the concentration dependence of the sedimentation and translational diffusion coefficients is considered, together with a suggestion for the necessary improvement in the optical system.
Keywords: Concentration dependence; Optical registration; Sedimentation coefficient; Sedimentation velocity; Ultracentrifugation.
© The Author(s) 2021.
Conflict of interest statement
Conflict of interestThe authors declare that they have no conflict of interest.
Figures
Similar articles
-
Allowance for radial dilution in evaluating the concentration dependence of sedimentation coefficients for globular proteins.Eur Biophys J. 2018 Apr;47(3):291-295. doi: 10.1007/s00249-017-1259-x. Epub 2017 Oct 4. Eur Biophys J. 2018. PMID: 28980105
-
Evaluation of diffusion coefficients by means of an approximate steady-state condition in sedimentation velocity distributions.Anal Biochem. 2015 Dec 1;490:20-5. doi: 10.1016/j.ab.2015.08.017. Epub 2015 Aug 28. Anal Biochem. 2015. PMID: 26321223
-
A model for sedimentation in inhomogeneous media. II. Compressibility of aqueous and organic solvents.Biophys Chem. 2004 Mar 1;108(1-3):201-14. doi: 10.1016/j.bpc.2003.10.017. Biophys Chem. 2004. PMID: 15043930
-
Allowance for boundary sharpening in the determination of diffusion coefficients by sedimentation velocity: a historical perspective.Biophys Rev. 2018 Feb;10(1):3-13. doi: 10.1007/s12551-017-0384-1. Epub 2018 Jan 27. Biophys Rev. 2018. PMID: 29380276 Free PMC article. Review.
-
Analytical ultracentrifugation for the study of protein association and assembly.Curr Opin Chem Biol. 2006 Oct;10(5):430-6. doi: 10.1016/j.cbpa.2006.08.017. Epub 2006 Aug 28. Curr Opin Chem Biol. 2006. PMID: 16935549 Review.
Cited by
-
Strong non-ideality effects at low protein concentrations: considerations for elongated proteins.Eur Biophys J. 2023 Jul;52(4-5):427-438. doi: 10.1007/s00249-023-01648-x. Epub 2023 Apr 13. Eur Biophys J. 2023. PMID: 37055656 Free PMC article.
-
Biophysical Reviews' "meet the editors series"-a profile of Steve Harding's career in macromolecular hydrodynamics.Biophys Rev. 2022 Jun 25;14(3):605-610. doi: 10.1007/s12551-022-00963-5. eCollection 2022 Jun. Biophys Rev. 2022. PMID: 35791390 Free PMC article.
-
Retrospective rationalization of disparities between the concentration dependence of diffusion coefficients obtained by boundary spreading and dynamic light scattering.Eur Biophys J. 2023 Jul;52(4-5):333-342. doi: 10.1007/s00249-023-01664-x. Epub 2023 Jul 7. Eur Biophys J. 2023. PMID: 37414903 Free PMC article.
-
Experimental support for reclassification of the light scattering second virial coefficient from macromolecular solutions as a hydrodynamic parameter.Eur Biophys J. 2023 Jul;52(4-5):343-352. doi: 10.1007/s00249-023-01665-w. Epub 2023 Jul 18. Eur Biophys J. 2023. PMID: 37460663 Free PMC article.
-
Biophysical Reviews: slowly getting back to 'normal'?Biophys Rev. 2021 Mar 31;13(2):161-165. doi: 10.1007/s12551-021-00797-7. eCollection 2021 Apr. Biophys Rev. 2021. PMID: 33821175 Free PMC article.
References
-
- Alberty RA. Variation of the sedimentation coefficient with time during a single velocity ultracentrifuge experiment. J Am Chem Soc. 1954;76:3733–3737.
-
- Arzensěk D, Kuzman D, Podgornik R. Colloidal interactions between monoclonal antibodies in aqueous solutions. J Colloid Interface Sci. 2012;334:207–216. - PubMed
-
- Batchelor GK. Sedimentation in a dilute solution of spheres. J Fluid Mech. 1972;52:245–268.
-
- Beenakker CWJ, Mazur P. Self-diffusion of spheres in a concentrated suspension. Physica. 1983;120A:388–410.
Publication types
LinkOut - more resources
Full Text Sources
Other Literature Sources
Miscellaneous
