. 2021 Apr 14:2021:5527292.
doi: 10.1155/2021/5527292. eCollection 2021.

Determination of Ischemia Onset Based on Automatically Generated Spectralis SD-OCT Values in Acute Central Retinal Artery Occlusion

Affiliations

Determination of Ischemia Onset Based on Automatically Generated Spectralis SD-OCT Values in Acute Central Retinal Artery Occlusion

Maria Casagrande et al. J Ophthalmol. .

Abstract

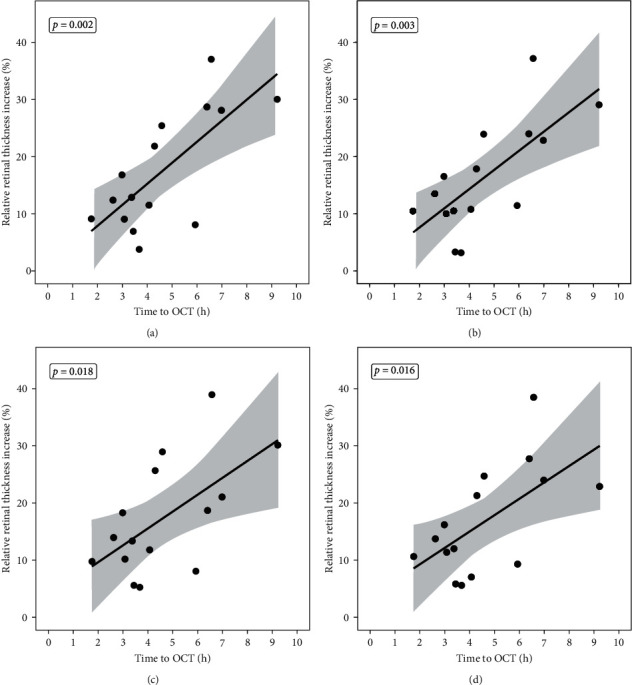
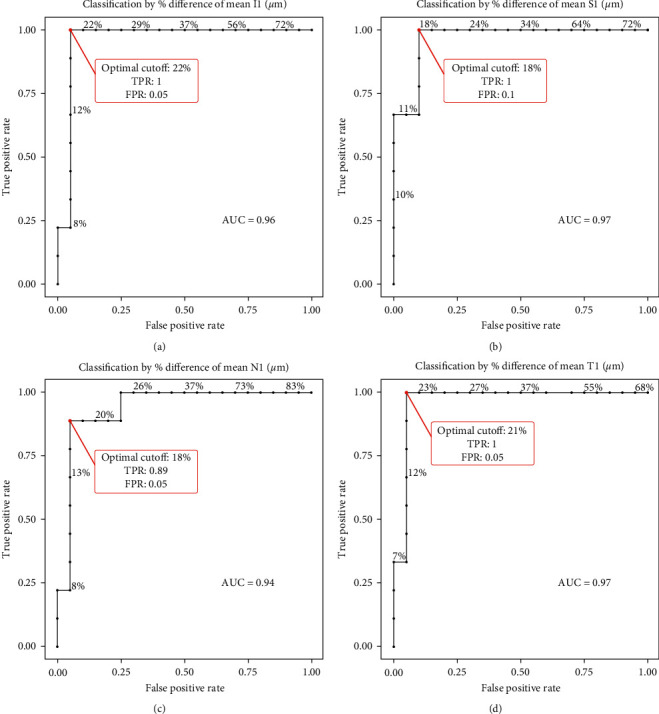
Acute central retinal artery occlusion (CRAO) induces a time-dependent increase in retinal thickness. By manually measuring the relative retinal thickness increase (RRTI) in comparison to the contralateral eye based on optical coherence tomography (OCT), ischemia onset within the past 4.5 hours could be determined with 100% sensitivity and 94.3% specificity. To enable examiner-independent and quicker diagnostics, we analyzed the RRTI using the automatic retinal thickness measurement. In this retrospective study, 28 eyes were evaluated with an acute CRAO (<46 hours). All patients received a Spectralis SD-OCT image of both eyes. The RRTI was calculated for the ETDRS sectors using the Segmentation Module for Single Retinal Layer Analysis. Receiver operating characteristic (ROC) analysis was performed to determine patients ≤4.5 hours by RRTI. In all sectors, time to OCT (TTO) and RRTI correlated positively. The optimal cutoff point to detect CRAOs ≤4.5 hours was between 18.7% nasally and 22.9% RRTI temporally. Sensitivity and specificity varied between the sectors with 90-95% sensitivity and 89-100% specificity. In conclusion, the automatic measurement of RRTI also allows the differentiation of CRAOs within a possible therapeutic time window ≤4.5 hours and CRAOs ≥4.5 hours with a high sensitivity and specificity. Additionally, it offers quicker, easier, and a user-independent assessment of ischemia onset, helping to set a base for establishing automatic indices generated by the OCT machines.


Conflict of interest statement

The authors declare that they have no conflicts of interest.

Figures

Figure 1
Figure 1
Representative time-dependent increase of the relative retinal thickness over 48 hours compared between manual and automatic measurements in the nasal sector. Relative retinal thickness increase (RRTI) in central retinal artery occlusion (CRAO) is caused by retinal ischemia. This figure shows the nasal ETDRS sector (n = 28) represented by the triangle and manually measured values from the previous study [5] represented by circles (n = 66). The x-axis represents time to OCT (TTO) and the y-axis the relative retinal thickness increase in percent.
Figure 2
Figure 2
Time-dependent increase of the relative retinal thickness over 10 hours. The figure displays the RRTI in all ETDRS sectors: (a) inferior, (b) superior, (c) nasal, and (d) temporal (n = 15). In every figure, the x-axis represents time to OCT (TTO) and the y-axis the RRTI in percent in the respective sectors. Every dot represents an analyzed patient. The straight line is the ordinary least squares (OLS) regression over the first 10 hours after ischemia onset. The grey region around the regression line describes the 95% confidence interval for the expected value of y given x. It reflects the confidence in estimated parameters.
Figure 3
Figure 3
Receiver operating characteristic (ROC) curve analysis. Calculation of the diagnostic performance of optical coherence tomography- (OCT-) based relative retinal thickness increase (RRTI) to distinguish between time to OCT of less and more than 4.5 hours in all 4 ETDRS sectors. The inferior sector (a), the superior sector (b), the nasal sector (c), and the temporal sector (d). On the y-axis, the true positive value represents sensitivity, while the x-axis shows false positive values from which the specificity can be calculated by 1 − false positive value. The area under the ROC curve (AUC) is given for each graph.
Figure 4
Figure 4
Automatic versus manual determination of retinal thickness representative optical coherence tomography (OCT) scan for the affected eye (a) and the unaffected eye (b). The scan in the unaffected eye is diagonal. Measurements are performed manually (orange line) and automatically (green line). The manual measurement equals 466 µm (a) and 335 µm (b), while the automatic is 474 µm (a) and 377 µm (b). The absolute retinal thickness increase (ARTI) is therefore different: 1.26 in the manual measurement and 1.39 in the automatic.
Figure 5
Figure 5
Signs of acute retinal ischemia in optical coherence tomography. This figure displays an optical coherence tomography (OCT) scan of a branch retinal artery occlusion with a time of symptom onset <2 hours. On the left side of the fovea, the retinal perfusion is intact, and the structure of the retinal layers is physiological. On the right side, where the branch retinal artery occlusion occurred, signs of ischemia can be seen in the scan. The white curly brace shows the hyperreflectivity in the inner layers of the retina. Consequently, the outer retinal layers and the retinal pigment epithelium show a hyporeflectivity—pointed out by the black curly brace. The black arrow points to the prominent middle-limiting membrane sign (pMLM). The white arrow symbolizes the thickening of the retina in comparison to the nonaffected part of the retina on the left side.

References

    1. Schrag M., Youn T., Schindler J., Kirshner H., Greer D. Intravenous fibrinolytic therapy in central retinal artery occlusion. JAMA Neurology. 2015;72(10):1148–1154. doi: 10.1001/jamaneurol.2015.1578. - DOI - PubMed
    1. Schultheiss M., Härtig F., Spitzer M. S., et al. Intravenous thrombolysis in acute central retinal artery occlusion-a prospective interventional case series. PLoS One. 2018;13(5) doi: 10.1371/journal.pone.0198114.e0198114 - DOI - PMC - PubMed
    1. Mac Grory B., Nackenoff A., Poli S., et al. Intravenous fibrinolysis for central retinal artery occlusion. Stroke. 2020;51(7):2018–2025. doi: 10.1161/strokeaha.119.028743. - DOI - PubMed
    1. Schmidt D., Schumacher M., Feltgen N. Circadian incidence of non-inflammatory retinal artery occlusions. Graefe’s Archive for Clinical and Experimental Ophthalmology. 2009;247(4):491–494. doi: 10.1007/s00417-008-0989-y. - DOI - PubMed
    1. Wenzel D. A., Kromer R., Poli S., et al. Optical coherence tomography-based determination of ischaemia onset-the temporal dynamics of retinal thickness increase in acute central retinal artery occlusion. Acta Ophthalmology. 2020;99 - PubMed

LinkOut - more resources