Response Efficacy of PD-1 and PD-L1 Inhibitors in Clinical Trials: A Systematic Review and Meta-Analysis
- PMID: 33937012
- PMCID: PMC8085334
- DOI: 10.3389/fonc.2021.562315
Response Efficacy of PD-1 and PD-L1 Inhibitors in Clinical Trials: A Systematic Review and Meta-Analysis
Abstract
Background: Immune checkpoint inhibitors targeting the PD-1/PD-L1 pathway have demonstrated promise in treating a variety of advanced cancers; however, little is known regarding their efficacy under various clinical situations, including different cancer types, treatment lines, drug combinations, and therapeutic regimens.
Methods: Published articles and conference abstracts (in English) in PubMed, Embase, the Cochrane Central Register, and Web of Science were searched up to February 10, 2020. The data were analyzed by the meta-analysis program in Stata.
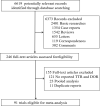
Results: A total of 16,400 patients from 91 clinical trials were included in this meta-analysis. PD-1/PD-L1 inhibitors had a mean ORR of 19.56% (95% CI: 15.09-24.03), a median TTR of 2.05 months (m) (95%CI: 1.85-2.26), and a median DOR of 10.65 m (95%CI: 7.78-13.52). First-line treatment had a higher ORR (36.57% vs. 13.18%) but a shorter DOR (9.00 m vs. 13.42 m) compared to the second-line or subsequent treatment. Immunotherapy combined with chemotherapy (I+C) (46.81% [95%CI: 36.02-57.60]) had a statistically significant higher ORR compared to immunotherapy (I) (17.75% [95%CI: 14.47-21.03]) or immunotherapy combined with immunotherapy (I+O) (12.25% [95%CI: 1.56-22.94]), while I+C (8.09 m [95%CI: 6.86-9.32]) appeared to reduce the DOR compared to I (12.39 m [95%CI: 7.60-17.18]). PD-1 inhibitors were associated with better ORR (21.65% vs. 17.60%) and DOR (11.26 m vs. 10.03 m) compared to PD-L1 inhibitors. There were no significant differences in TTR under different situations.
Conclusions: PD-1/PD-L1 inhibitors were promising immunotherapeutic agents to achieve satisfactory response efficacies with different cancer types, treatment lines, drug combinations, and therapeutic regimens. This comprehensive summary of the response efficacy of PD-1/PD-L1 inhibitors serves as a reference for clinicians to make evidence-based decisions.
Keywords: PD-1/PD-L1 inhibitors; duration of response; meta-analysis; objective response rate; response efficacy; time to response.
Copyright © 2021 Chen, Zhang, Zheng, Tao, Zhang, Ma, Liu, Wang, Qian, Cui, Huang, Huang, Wu and Hu.
Conflict of interest statement
The authors declare that the research was conducted in the absence of any commercial or financial relationships that could be construed as a potential conflict of interest.
Figures


References
Publication types
LinkOut - more resources
Full Text Sources
Other Literature Sources
Medical
Research Materials
Miscellaneous

