. 2021 Apr 22;3(2):lqab025.
doi: 10.1093/nargab/lqab025. eCollection 2021 Jun.

Human methylome variation across Infinium 450K data on the Gene Expression Omnibus

Affiliations

Human methylome variation across Infinium 450K data on the Gene Expression Omnibus

Sean K Maden et al. NAR Genom Bioinform. .

Abstract

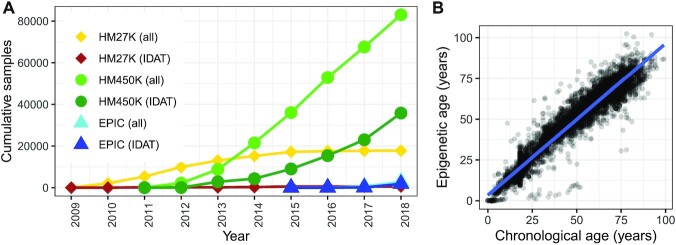
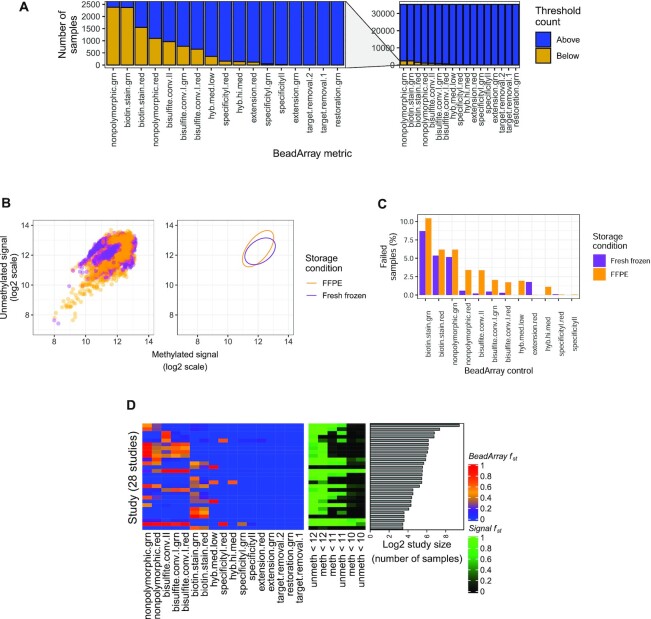
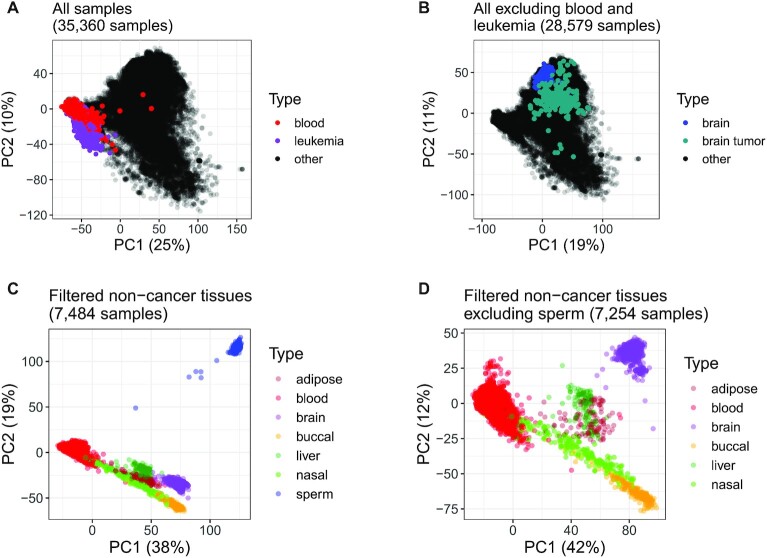
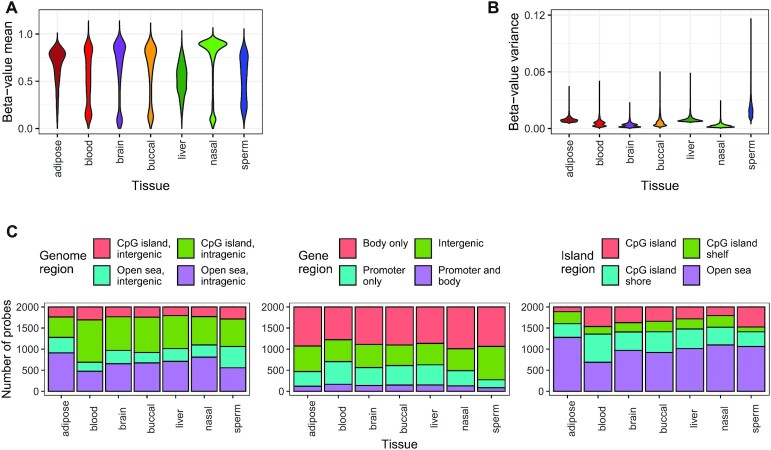
While DNA methylation (DNAm) is the most-studied epigenetic mark, few recent studies probe the breadth of publicly available DNAm array samples. We collectively analyzed 35 360 Illumina Infinium HumanMethylation450K DNAm array samples published on the Gene Expression Omnibus. We learned a controlled vocabulary of sample labels by applying regular expressions to metadata and used existing models to predict various sample properties including epigenetic age. We found approximately two-thirds of samples were from blood, one-quarter were from brain and one-third were from cancer patients. About 19% of samples failed at least one of Illumina's 17 prescribed quality assessments; signal distributions across samples suggest modifying manufacturer-recommended thresholds for failure would make these assessments more informative. We further analyzed DNAm variances in seven tissues (adipose, nasal, blood, brain, buccal, sperm and liver) and characterized specific probes distinguishing them. Finally, we compiled DNAm array data and metadata, including our learned and predicted sample labels, into database files accessible via the recountmethylation R/Bioconductor companion package. Its vignettes walk the user through some analyses contained in this paper.


Figures

Figure 1.
Figure 1.
Cross-study summaries of DNAm array samples from GEO. (A) Cumulative samples by year using one of three major Illumina BeadArray DNAm array platforms (HM27K, HM450K and EPIC/HM850K, point shapes), showing either all samples or subsets with available IDAT files for each platform (line colors). Samples with IDATs using the HM450K platform (dark green line, circle shape) were compiled and analyzed (‘Materials and Methods’ and ‘Results’ sections). (B) Scatter plot of mined chronological (x-axis) and epigenetic (y-axis) ages, in years, with linear model fit (blue line), for 6019 non-cancer tissues run using the HM450K platform (‘Results’ section). Chronological age was mined from sample metadata. Epigenetic age was calculated using the model in (5) (‘Materials and Methods’ section).
Figure 2.
Figure 2.
Quality analyses across samples, storage conditions, and studies. (A) Barplots counting samples (y-axis) falling above (blue) or below (gold) manufacturer-prescribed thresholds across the 17 BeadArray controls (x-axis). Full view is on right, and magnification is on left. (B) Scatter plots (left) and 95% confidence intervals (right) for log2 median methylated (x-axis) and log2 median unmethylated (y-axis) signal of 3467 formalin-fixed paraffin embedded (FFPE, orange) and 5729 fresh frozen samples (purple). (C) Percentages of FFPE (orange) and fresh frozen (purple) samples failing BeadArray controls. (D) Heatmaps depicting fraction (fst in legends) of samples in a study failing quality assessments across 28 studies with high failure rates (fst > 60%) and >10 samples. BeadArray fst values are shown on the left, where blue is low, orange is intermediate and red is high. Signal fst values for three methylated (M, ‘meth’) and unmethylated (U, ‘unmeth’) signal levels (10, 11 and 12) are shown in the middle, where black is low, dark green intermediate and light green is high. The log2 study sizes are shown on the right.
Figure 3.
Figure 3.
Scatter plots of top two components from PCAs of autosomal DNAm (‘Materials and Methods’ section). Each axis label also contains percent of total variance explained by the component. (A) PCA of 35 360 samples, with color labels for non-cancer blood (N = 6001 samples, red points) and leukemias (780, purple) and remaining samples (28 579, black). (B) PCA of 28 579 samples remaining after exclusion of blood and leukemias from (A), highlighting non-cancer brain (N = 602 samples, blue), brain tumors (221, dark cyan) and remaining samples (27 756, black points). Facet plots of sample subsets in (A) and (B) are shown in Supplementary Figure S6. (C) and (D) display samples from seven non-cancer tissues for which at least 100 samples were available from at least two studies (‘Materials and Methods’ section). (C) PCA of 7484 samples from all seven tissue types, including sperm (N = 230 samples, blue), adipose (104, dark red), blood (6,001, red), brain (602, purple), buccal (244, orange), nasal (191, light green) and liver (112, dark green). (D) PCA of 7254 non-cancer tissue samples remaining from (C) after exclusion of sperm, with color labels as in (C).
Figure 4.
Figure 4.
DNAm and genome mapping patterns among 14 000 CpG probes showing tissue-specific high variance in seven tissues (2000 probes per tissue, tissues: adipose, blood, brain, buccal, liver, nasal and sperm). (A and B) Violin plots of (A) means and (B) variances of normalized Beta-values across tissue-specific probes. (C) Stacked barplots of genome region mappings (number of CpG probes, y-axis) across tissue-specific probes (x-axis). Color fills depict (left) island and gene overlap, (center) gene region overlap and (right) island region overlap.

References

    1. Feinberg A.P., Tycko B. The history of cancer epigenetics. Nat. Rev. Cancer. 2004; 4:143–153. - PubMed
    1. Ziller M.J., Gu H., Müller F., Donaghey J., Tsai L.T.-Y., Kohlbacher O., De Jager P.L., Rosen E.D., Bennett D.A., Bernstein B.E. et al. . Charting a dynamic DNA methylation landscape of the human genome. Nature. 2013; 500:477–481. - PMC - PubMed
    1. Lokk K., Modhukur V., Rajashekar B., Märtens K., Mägi R., Kolde R., Koltšina M., Nilsson T.K., Vilo J., Salumets A. et al. . DNA methylome profiling of human tissues identifies global and tissue-specific methylation patterns. Genome Biol. 2014; 15:r54. - PMC - PubMed
    1. Jones P.A. Functions of DNA methylation: islands, start sites, gene bodies and beyond. Nat. Rev. Genet. 2012; 13:484–492. - PubMed
    1. Horvath S. DNA methylation age of human tissues and cell types. Genome Biol. 2013; 14:R115. - PMC - PubMed