The Effect of Image Resolution on Deep Learning in Radiography
- PMID: 33937810
- PMCID: PMC8017385
- DOI: 10.1148/ryai.2019190015
The Effect of Image Resolution on Deep Learning in Radiography
Abstract
Purpose: To examine variations of convolutional neural network (CNN) performance for multiple chest radiograph diagnoses and image resolutions.
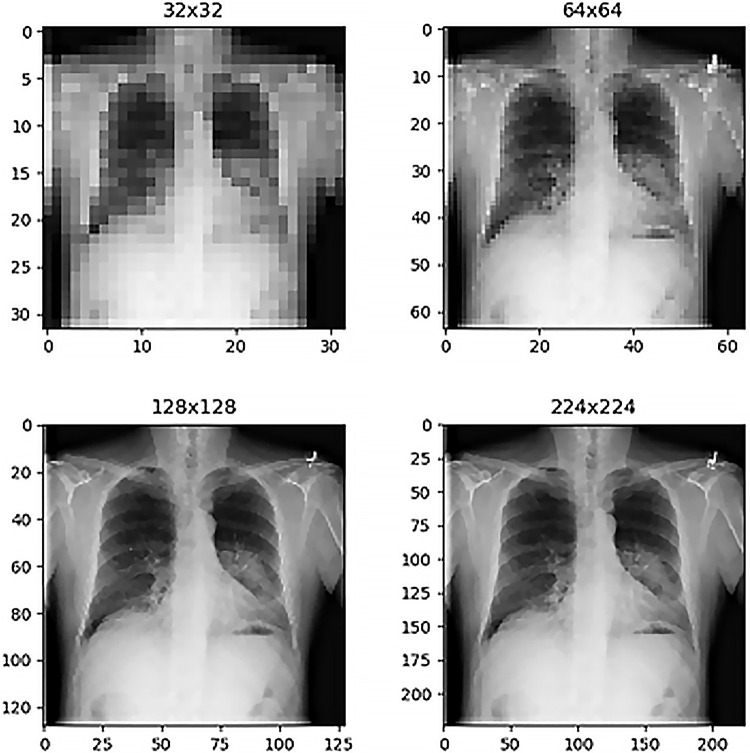
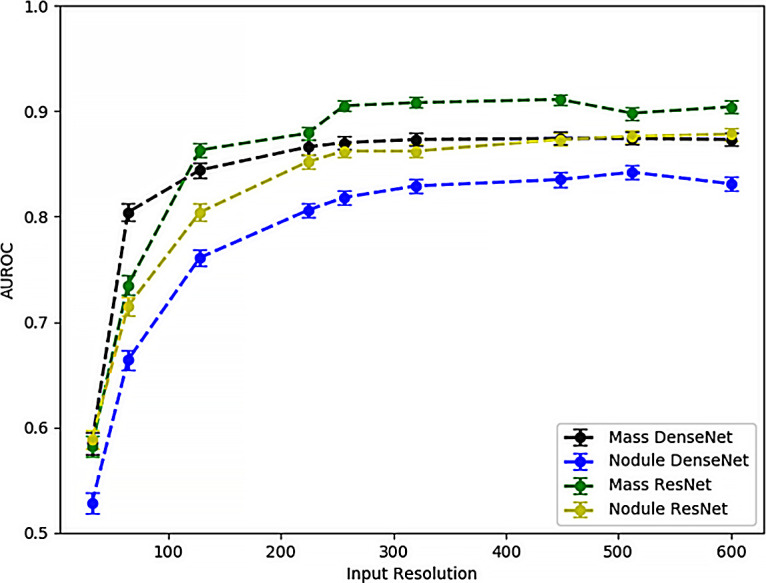
Materials and methods: This retrospective study examined CNN performance using the publicly available National Institutes of Health chest radiograph dataset comprising 112 120 chest radiographic images from 30 805 patients. The network architectures examined included ResNet34 and DenseNet121. Image resolutions ranging from 32 × 32 to 600 × 600 pixels were investigated. Network training paradigms used 80% of samples for training and 20% for validation. CNN performance was evaluated based on area under the receiver operating characteristic curve (AUC) and label accuracy. Binary output networks were trained separately for each label or diagnosis under consideration.
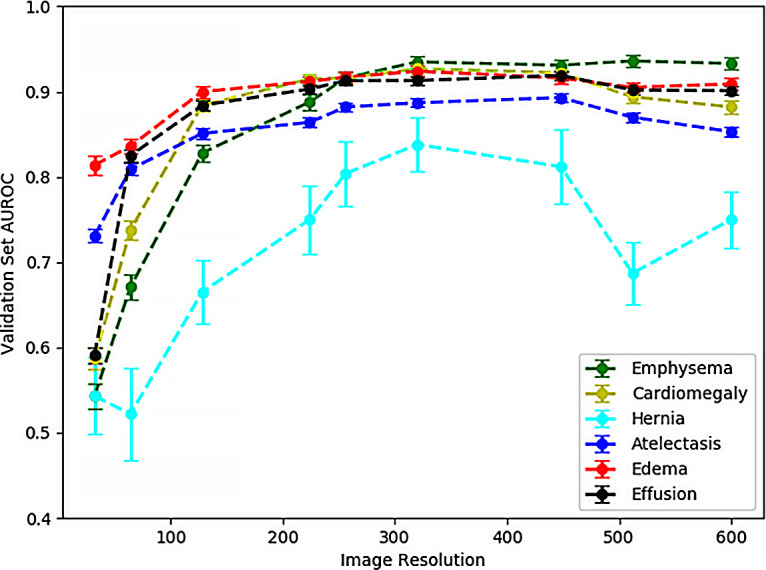
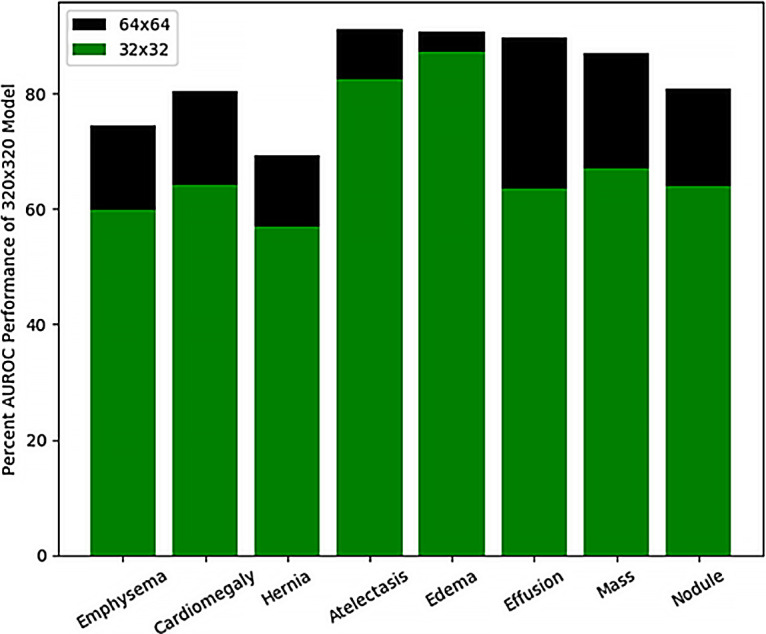
Results: Maximum AUCs were achieved at image resolutions between 256 × 256 and 448 × 448 pixels for binary decision networks targeting emphysema, cardiomegaly, hernias, edema, effusions, atelectasis, masses, and nodules. When comparing performance between networks that utilize lower resolution (64 × 64 pixels) versus higher (320 × 320 pixels) resolution inputs, emphysema, cardiomegaly, hernia, and pulmonary nodule detection had the highest fractional improvements in AUC at higher image resolutions. Specifically, pulmonary nodule detection had an AUC performance ratio of 80.7% ± 1.5 (standard deviation) (0.689 of 0.854) whereas thoracic mass detection had an AUC ratio of 86.7% ± 1.2 (0.767 of 0.886) for these image resolutions.
Conclusion: Increasing image resolution for CNN training often has a trade-off with the maximum possible batch size, yet optimal selection of image resolution has the potential for further increasing neural network performance for various radiology-based machine learning tasks. Furthermore, identifying diagnosis-specific tasks that require relatively higher image resolution can potentially provide insight into the relative difficulty of identifying different radiology findings. Supplemental material is available for this article. © RSNA, 2020See also the commentary by Lakhani in this issue.
2020 by the Radiological Society of North America, Inc.
Conflict of interest statement
Disclosures of Conflicts of Interest: C.F.S. disclosed no relevant relationships. B.M.S. disclosed no relevant relationships.
Figures
Comment in
-
The Importance of Image Resolution in Building Deep Learning Models for Medical Imaging.Radiol Artif Intell. 2020 Jan 22;2(1):e190177. doi: 10.1148/ryai.2019190177. eCollection 2020 Jan. Radiol Artif Intell. 2020. PMID: 33939779 Free PMC article. No abstract available.
References
-
- Rajpurkar P , Irvin J , Zhu K , et al . CheXNet: radiologist-level pneumonia detection on chest x-rays with deep learning . ArXiv 1711.05225 [preprint] http://arxiv.org/abs/1711.05225. Posted 2017. Accessed February 2, 2019 .
-
- Irvin J , Rajpurkar P , Ko M , et al . CheXpert: a large chest radiograph dataset with uncertainty labels and expert comparison . http://www.aaai.org. Accessed February 2, 2019 .
-
- Wang X , Peng Y , Lu L , Lu Z , Bagheri M , Summers RM . ChestX-ray8: hospital-scale chest x-ray database and benchmarks on weakly-supervised classification and localization of common thorax diseases . https://uts.nlm.nih.gov/metathesaurus.html. Accessed February 2, 2019 .
-
- Yao L , Poblenz E , Dagunts D , Covington B , Bernard D , Lyman K . Learning to diagnose from scratch by exploiting dependencies among labels . ArXiv 1710.10501 [preprint] https://arxiv.org/abs/1710.10501. Posted 2017. Accessed February 2, 2019 .
-
- Battiti R . Using mutual information for selecting features in supervised neural net learning . IEEE Trans Neural Netw 1994. ; 5 ( 4 ): 537 – 550 . - PubMed
LinkOut - more resources
Full Text Sources
Other Literature Sources