. 2020 Jul 1;2(4):e190195.
doi: 10.1148/ryai.2020190195. eCollection 2020 Jul.

MRI Manufacturer Shift and Adaptation: Increasing the Generalizability of Deep Learning Segmentation for MR Images Acquired with Different Scanners

Affiliations

MRI Manufacturer Shift and Adaptation: Increasing the Generalizability of Deep Learning Segmentation for MR Images Acquired with Different Scanners

Wenjun Yan et al. Radiol Artif Intell. .

Abstract

Purpose: To quantitatively evaluate the generalizability of a deep learning segmentation tool to MRI data from scanners of different MRI manufacturers and to improve the cross-manufacturer performance by using a manufacturer-adaptation strategy.

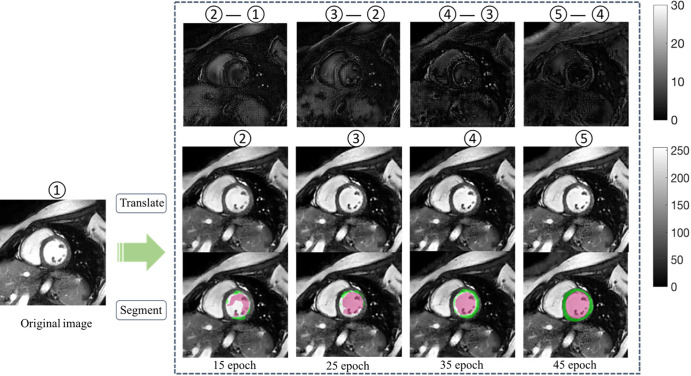
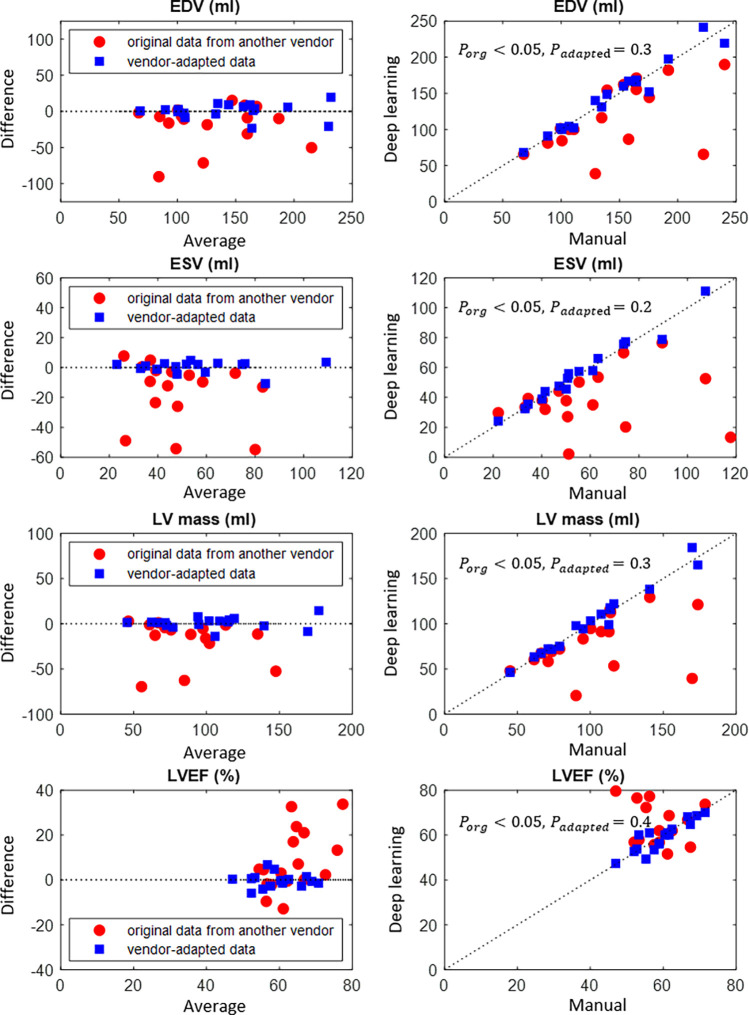
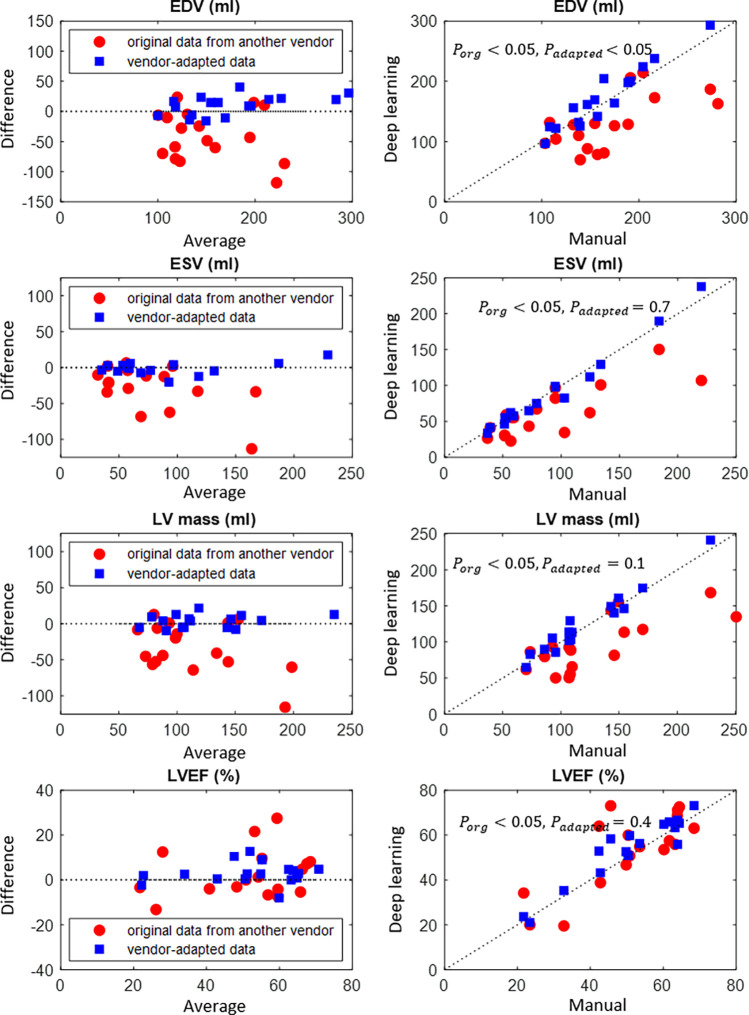
Materials and methods: This retrospective study included 150 cine MRI datasets from three MRI manufacturers, acquired between 2017 and 2018 (n = 50 for manufacturer 1, manufacturer 2, and manufacturer 3). Three convolutional neural networks (CNNs) were trained to segment the left ventricle (LV), using datasets exclusively from images from a single manufacturer. A generative adversarial network (GAN) was trained to adapt the input image before segmentation. The LV segmentation performance, end-diastolic volume (EDV), end-systolic volume (ESV), LV mass, and LV ejection fraction (LVEF) were evaluated before and after manufacturer adaptation. Paired Wilcoxon signed rank tests were performed.

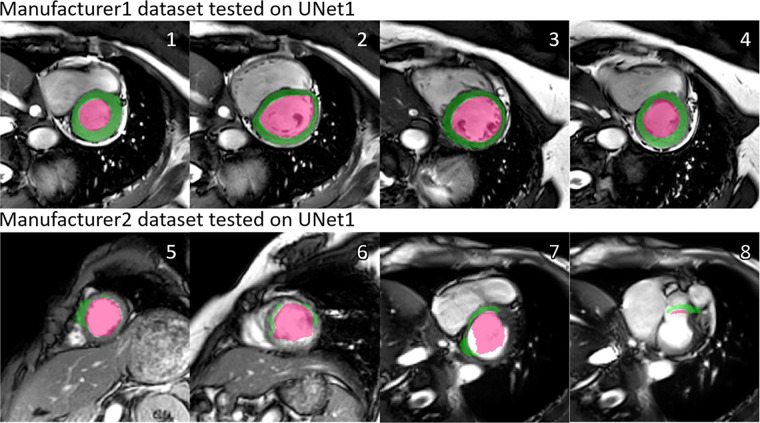
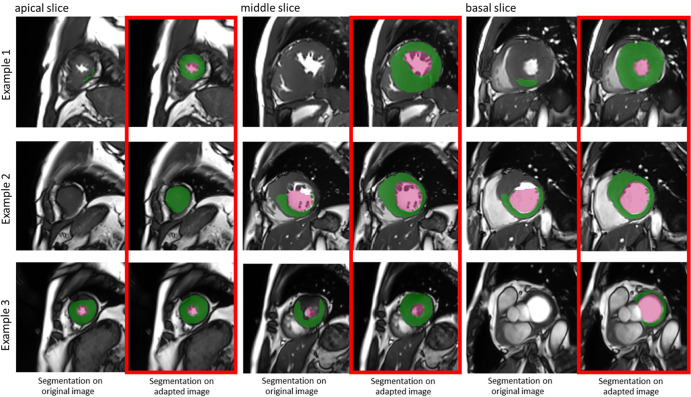
Results: The segmentation CNNs exhibited a significant performance drop when applied to datasets from different manufacturers (Dice reduced from 89.7% ± 2.3 [standard deviation] to 68.7% ± 10.8, P < .05, from 90.6% ± 2.1 to 59.5% ± 13.3, P < .05, from 89.2% ± 2.3 to 64.1% ± 12.0, P < .05, for manufacturer 1, 2, and 3, respectively). After manufacturer adaptation, the segmentation performance was significantly improved (from 68.7% ± 10.8 to 84.3% ± 6.2, P < .05, from 72.4% ± 10.2 to 85.7% ± 6.5, P < .05, for manufacturer 2 and 3, respectively). Quantitative LV function parameters were also significantly improved. For LVEF, the manufacturer adaptation increased the Pearson correlation from 0.005 to 0.89 for manufacturer 2 and from 0.77 to 0.94 for manufacturer 3.

Conclusion: A segmentation CNN well trained on datasets from one MRI manufacturer may not generalize well to datasets from other manufacturers. The proposed manufacturer adaptation can largely improve the generalizability of a deep learning segmentation tool without additional annotation.Supplemental material is available for this article.© RSNA, 2020.


Conflict of interest statement

Disclosures of Conflicts of Interest: W.Y. Activities related to the present article: institution received money from National Key Research and Development Program of China under Grant 2018YFC0116303. Activities not related to the present article: disclosed no relevant relationships. Other relationships: disclosed no relevant relationships. L.H. disclosed no relevant relationships. L.X. disclosed no relevant relationships. S.G. disclosed no relevant relationships. F.Y. disclosed no relevant relationships. Y.W. Activities related to the present article: institution received money from National Key Research and Development Program of China under Grant 2018YFC0116303. Activities not related to the present article: disclosed no relevant relationships. Other relationships: disclosed no relevant relationships. Q.T. disclosed no relevant relationships.

Figures

Illustration of the manufacturer shift problem. The upper row shows the performance of U-Net 1 tested on datasets from manufacturer 1, and the lower row shows the performance of U-Net 1 tested on datasets from manufacturer 2. A performance drop can be observed, in the form of undersegmentation. Numbers at upper right corner of each subfigure indicate different examples. Green regions denote the automatic myocardium segmentation results by the U-Net, while red regions denote the blood pool segmentation results.
Figure 1:
Illustration of the manufacturer shift problem. The upper row shows the performance of U-Net 1 tested on datasets from manufacturer 1, and the lower row shows the performance of U-Net 1 tested on datasets from manufacturer 2. A performance drop can be observed, in the form of undersegmentation. Numbers at upper right corner of each subfigure indicate different examples. Green regions denote the automatic myocardium segmentation results by the U-Net, while red regions denote the blood pool segmentation results.
Three examples show boost of segmentation performance after manufacturer adaptation. Examples from apical, middle, and basal slices are given. In each subfigure, the left column shows segmentation results on original data from another manufacturer, while the right (red box) shows segmentation results on manufacturer-adapted data. Green regions denote the automatic myocardium segmentation results by the U-Net, while red regions denote the blood pool segmentation results.
Figure 2:
Three examples show boost of segmentation performance after manufacturer adaptation. Examples from apical, middle, and basal slices are given. In each subfigure, the left column shows segmentation results on original data from another manufacturer, while the right (red box) shows segmentation results on manufacturer-adapted data. Green regions denote the automatic myocardium segmentation results by the U-Net, while red regions denote the blood pool segmentation results.
The performance of U-Net trained on one manufacturer dataset improved on dataset from another manufacturer, along with training epochs. Middle row shows adapted images at different epochs. Bottom row shows the corresponding segmentation results after manufacturer adaptation using the same U-Net. Upper row illustrates the subtle difference between the adapted images (scale indicated by gray-scale bar). Numbers 1–5 mark image at different adaptation stages, with 5 being the final adapted image. Green regions denote the automatic myocardium segmentation results by the U-Net, while red regions denote the blood pool segmentation results.
Figure 3:
The performance of U-Net trained on one manufacturer dataset improved on dataset from another manufacturer, along with training epochs. Middle row shows adapted images at different epochs. Bottom row shows the corresponding segmentation results after manufacturer adaptation using the same U-Net. Upper row illustrates the subtle difference between the adapted images (scale indicated by gray-scale bar). Numbers 1–5 mark image at different adaptation stages, with 5 being the final adapted image. Green regions denote the automatic myocardium segmentation results by the U-Net, while red regions denote the blood pool segmentation results.
Bland-Altman plots of quantitative parameters derived by automated segmentation for manufacturer 2 data, compared with the manual reference standard. Red dots represent results before manufacturer adaptation, and blue squares represent results after manufacturer adaptation. Four quantitative parameters are reported: end-systolic volume (ESV), end-diastolic volume (EDV), left ventricular (LV) mass, and left ventricular ejection fraction (LVEF). The P values by the paired Wilcoxon signed rank test were reported: Porg is P value comparing results from the original MRI with the ground truth, Padapted is P value comparing results from the manufacturer-adapted MRI with the ground truth.
Figure 4:
Bland-Altman plots of quantitative parameters derived by automated segmentation for manufacturer 2 data, compared with the manual reference standard. Red dots represent results before manufacturer adaptation, and blue squares represent results after manufacturer adaptation. Four quantitative parameters are reported: end-systolic volume (ESV), end-diastolic volume (EDV), left ventricular (LV) mass, and left ventricular ejection fraction (LVEF). The P values by the paired Wilcoxon signed rank test were reported: Porg is P value comparing results from the original MRI with the ground truth, Padapted is P value comparing results from the manufacturer-adapted MRI with the ground truth.
Bland-Altman plots of quantitative parameters derived by automated segmentation for manufacturer 3 data, compared with the manual reference standard. Red dots represent results before manufacturer adaptation, blue squares represent results after manufacturer adaptation. Four quantitative parameters are reported: end-systolic volume (ESV), end-diastolic volume (EDV), left ventricular (LV) mass, and left ventricular ejection fraction (LVEF). The P values by the paired Wilcoxon signed rank test were reported: Porg is P value comparing results from the original MRI with the ground truth, Padapted is P value comparing results from the manufacturer-adapted MRI with the ground truth.
Figure 5:
Bland-Altman plots of quantitative parameters derived by automated segmentation for manufacturer 3 data, compared with the manual reference standard. Red dots represent results before manufacturer adaptation, blue squares represent results after manufacturer adaptation. Four quantitative parameters are reported: end-systolic volume (ESV), end-diastolic volume (EDV), left ventricular (LV) mass, and left ventricular ejection fraction (LVEF). The P values by the paired Wilcoxon signed rank test were reported: Porg is P value comparing results from the original MRI with the ground truth, Padapted is P value comparing results from the manufacturer-adapted MRI with the ground truth.

References

    1. McRobbie DW, Moore EA, Graves MJ, Prince MR. MRI from Picture to Proton. Cambridge Core. 2006. http://cambridge.org/core/books/mri-from-picture-to-proton/3ADC814FF8FC6.... Accessed October 10, 2019.
    1. Shen D, Wu G, Suk HI. Deep Learning in Medical Image Analysis. Annu Rev Biomed Eng 2017;19(1):221–248. - PMC - PubMed
    1. Lakhani P, Prater AB, Hutson RK, et al. . Machine Learning in Radiology: Applications Beyond Image Interpretation. J Am Coll Radiol 2018;15(2):350–359. - PubMed
    1. Tao Q, Yan W, Wang Y, et al. . Deep Learning-based Method for Fully Automatic Quantification of Left Ventricle Function from Cine MR Images: A Multivendor, Multicenter Study. Radiology 2019;290(1):81–88. - PubMed
    1. Kurata Y, Nishio M, Kido A, et al. . Automatic segmentation of the uterus on MRI using a convolutional neural network. Comput Biol Med 2019;114:103438. - PubMed

LinkOut - more resources