. 2020 Sep 23;2(5):e190146.
doi: 10.1148/ryai.2020190146. eCollection 2020 Sep.

Subspecialty-Level Deep Gray Matter Differential Diagnoses with Deep Learning and Bayesian Networks on Clinical Brain MRI: A Pilot Study

Affiliations

Subspecialty-Level Deep Gray Matter Differential Diagnoses with Deep Learning and Bayesian Networks on Clinical Brain MRI: A Pilot Study

Jeffrey D Rudie et al. Radiol Artif Intell. .

Abstract

Purpose: To develop and validate a system that could perform automated diagnosis of common and rare neurologic diseases involving deep gray matter on clinical brain MRI studies.

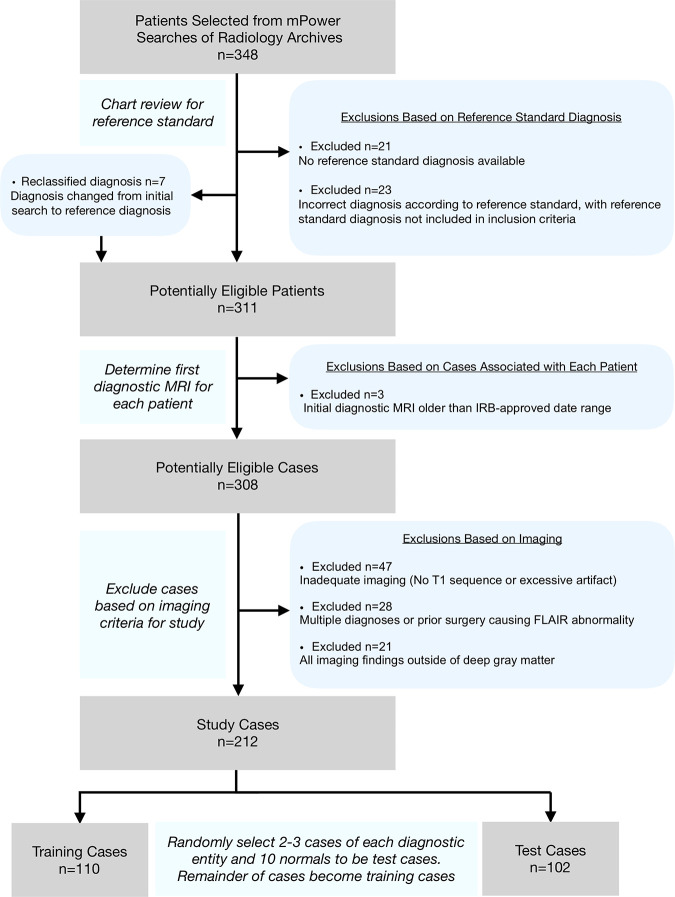
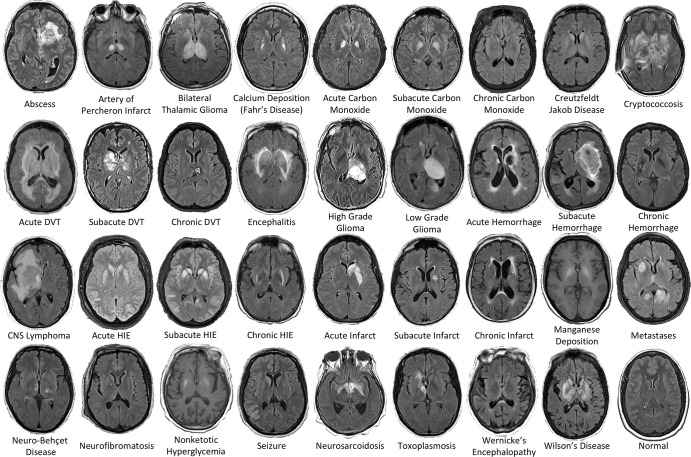
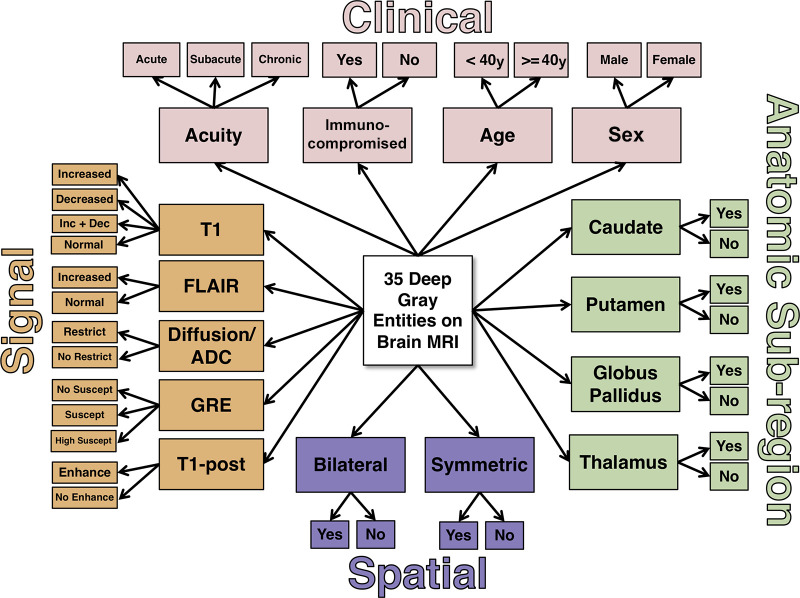
Materials and methods: In this retrospective study, multimodal brain MRI scans from 212 patients (mean age, 55 years ± 17 [standard deviation]; 113 women) with 35 neurologic diseases and normal brain MRI scans obtained between January 2008 and January 2018 were included (110 patients in the training set, 102 patients in the test set). MRI scans from 178 patients (mean age, 48 years ± 17; 106 women) were used to supplement training of the neural networks. Three-dimensional convolutional neural networks and atlas-based image processing were used for extraction of 11 imaging features. Expert-derived Bayesian networks incorporating domain knowledge were used for differential diagnosis generation. The performance of the artificial intelligence (AI) system was assessed by comparing diagnostic accuracy with that of radiologists of varying levels of specialization by using the generalized estimating equation with robust variance estimator for the top three differential diagnoses (T3DDx) and the correct top diagnosis (TDx), as well as with receiver operating characteristic analyses.

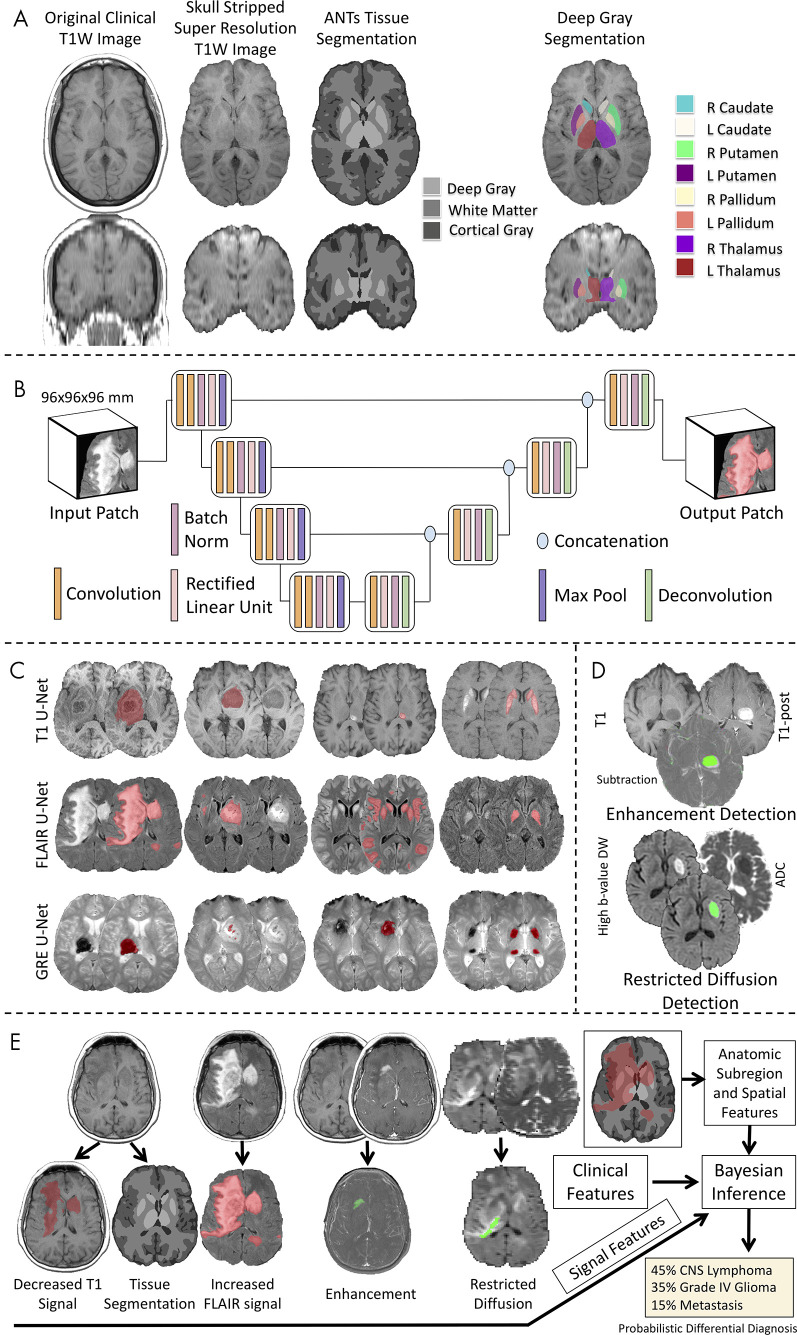
Results: In the held-out test set, the imaging pipeline detected 11 key features on brain MRI scans with 89% accuracy (sensitivity, 81%; specificity, 95%) relative to academic neuroradiologists. The Bayesian network, integrating imaging features with clinical information, had an accuracy of 85% for T3DDx and 64% for TDx, which was better than that of radiology residents (n = 4; 56% for T3DDx, 36% for TDx; P < .001 for both) and general radiologists (n = 2; 53% for T3DDx, 31% for TDx; P < .001 for both). The accuracy of the Bayesian network was better than that of neuroradiology fellows (n = 2) for T3DDx (72%; P = .003) but not for TDx (59%; P = .19) and was not different from that of academic neuroradiologists (n = 2; 84% T3DDx, 65% TDx; P > .09 for both).

Conclusion: A hybrid AI system was developed that simultaneously provides a quantitative assessment of disease burden, explainable intermediate imaging features, and a probabilistic differential diagnosis that performed at the level of academic neuroradiologists. This type of approach has the potential to improve clinical decision making for common and rare diseases.Supplemental material is available for this article.© RSNA, 2020.


Conflict of interest statement

Disclosures of Conflicts of Interest: J.D.R. disclosed no relevant relationships. A.M.R. disclosed no relevant relationships. L.X. Activities related to the present article: disclosed no relevant relationships. Activities not related to the present article: is a paid consultant for Galileo. Other relationships: disclosed no relevant relationships. J.W. disclosed no relevant relationships. M.T.D. disclosed no relevant relationships. E.J.B. disclosed no relevant relationships. A.K. disclosed no relevant relationships. J.M.E. disclosed no relevant relationships. T.C. Activities related to the present article: disclosed no relevant relationships. Activities not related to the present article: receives royalties from the Osler Institute; received travel expenses and honorarium for participation in a day-long program from RadPartners AI Summit. Other relationships: disclosed no relevant relationships. R.N.B. Activities related to the present article: disclosed no relevant relationships. Activities not related to the present article: is on the board at Galileo CDS; has stock/stock options in Galileo CDS. Other relationships: has patents issued to the University of Pennsylvania; has a patent licensed from the University of Pennsylvania to Galileo CDS. I.M.N. disclosed no relevant relationships. S.M. Activities related to the present article: disclosed no relevant relationships. Activities not related to the present article: is a paid consultant for Northwest Biotherapeutics; institution has grants/grants pending from NovoCure, Galileo, Guerbet, and ACC. Other relationships: disclosed no relevant relationships. J.C.G. disclosed no relevant relationships.

Figures

Flowchart for case selection. After selecting 348 patients with the diseases included in the study from mPower (Nuance Communications, Burlington, Mass) searches, chart reviews were performed to confirm the diagnoses. The first diagnostic MRI scan was chosen, and then the final cases were selected by excluding cases with inadequate imaging (eg, missing sequences or excessive motion), multiple diagnoses, or imaging findings outside deep gray matter. The final sample (n = 212) was then randomized into training cases (n = 110) and test cases (n = 102) by randomly selecting two to three cases of each diagnostic entity and 10 normal cases to the test cases. The remainder of the cases became training cases. FLAIR = fluid-attenuated inversion recovery, IRB = institutional review board.
Figure 1:
Flowchart for case selection. After selecting 348 patients with the diseases included in the study from mPower (Nuance Communications, Burlington, Mass) searches, chart reviews were performed to confirm the diagnoses. The first diagnostic MRI scan was chosen, and then the final cases were selected by excluding cases with inadequate imaging (eg, missing sequences or excessive motion), multiple diagnoses, or imaging findings outside deep gray matter. The final sample (n = 212) was then randomized into training cases (n = 110) and test cases (n = 102) by randomly selecting two to three cases of each diagnostic entity and 10 normal cases to the test cases. The remainder of the cases became training cases. FLAIR = fluid-attenuated inversion recovery, IRB = institutional review board.
Examples of the 36 diagnostic entities included the study. All MRI scans are axial T2-weighted fluid-attenuated inversion recovery images except for manganese deposition and nonketotic hyperglycemia scans, which are T1-weighted images. CNS = central nervous system, DVT = deep vein thrombosis, HIE = hypoxic-ischemic encephalopathy.
Figure 2:
Examples of the 36 diagnostic entities included the study. All MRI scans are axial T2-weighted fluid-attenuated inversion recovery images except for manganese deposition and nonketotic hyperglycemia scans, which are T1-weighted images. CNS = central nervous system, DVT = deep vein thrombosis, HIE = hypoxic-ischemic encephalopathy.
Workflow of the image processing pipeline. A, Atlas-based neuroimaging processing pipeline for tissue segmentation and deep gray matter parcellation. T1-weighted (T1W) axial (upper row) and coronal (lower row) MRI scans were up-sampled and skull-stripped (second column) before tissue segmentation with the Advanced Normalization Tools (ANTs) pipeline (third column) and parcellation of deep gray matter structures (fourth column). B, Diagrammatic overview of the custom three-dimensional U-Net architecture for abnormal signal detection. C, Examples of U-Net–based segmentations for T1-weighted (T1, first row), T2-weighted fluid-attenuated inversion recovery (FLAIR, second row), and gradient-recalled echo (GRE, third row) MRI scans of test case. D, Example of T1-weighted (T1), T1-weighted postcontrast (T1-post), and a subtraction of the T1-weighted image from the T1-weighted postcontrast image with detected areas of abnormal enhancement (green) and high b value diffusion-weighted (DW) and apparent diffusion coefficient (ADC) images with detected areas of restricted diffusion (green). E, Example of correctly diagnosed central nervous system (CNS) lymphoma processed through the full pipeline with signal, anatomic subregion, and spatial features (derived from abnormal signal segmentations overlaid on tissue segmentation maps) combined with clinical features into a Bayesian inference system to derive a probabilistic differential diagnosis.
Figure 3:
Workflow of the image processing pipeline. A, Atlas-based neuroimaging processing pipeline for tissue segmentation and deep gray matter parcellation. T1-weighted (T1W) axial (upper row) and coronal (lower row) MRI scans were up-sampled and skull-stripped (second column) before tissue segmentation with the Advanced Normalization Tools (ANTs) pipeline (third column) and parcellation of deep gray matter structures (fourth column). B, Diagrammatic overview of the custom three-dimensional U-Net architecture for abnormal signal detection. C, Examples of U-Net–based segmentations for T1-weighted (T1, first row), T2-weighted fluid-attenuated inversion recovery (FLAIR, second row), and gradient-recalled echo (GRE, third row) MRI scans of test case. D, Example of T1-weighted (T1), T1-weighted postcontrast (T1-post), and a subtraction of the T1-weighted image from the T1-weighted postcontrast image with detected areas of abnormal enhancement (green) and high b value diffusion-weighted (DW) and apparent diffusion coefficient (ADC) images with detected areas of restricted diffusion (green). E, Example of correctly diagnosed central nervous system (CNS) lymphoma processed through the full pipeline with signal, anatomic subregion, and spatial features (derived from abnormal signal segmentations overlaid on tissue segmentation maps) combined with clinical features into a Bayesian inference system to derive a probabilistic differential diagnosis.
Naive expert-trained deep gray Bayesian network overview. Key image signal, spatial pattern, and anatomic subregion features are probabilistically combined with four clinical features to calculate a probability of each diagnostic state. ADC = apparent diffusion coefficient, Dec = decreased, Enhance = enhancement, FLAIR = fluid-attenuated inversion recovery, GRE = gradient-recalled echo, Inc = increased, Restrict = restricted diffusion, Suscept = susceptibility, T1 = T1-weighted, T1-post = T1-weighted postcontrast.
Figure 4:
Naive expert-trained deep gray Bayesian network overview. Key image signal, spatial pattern, and anatomic subregion features are probabilistically combined with four clinical features to calculate a probability of each diagnostic state. ADC = apparent diffusion coefficient, Dec = decreased, Enhance = enhancement, FLAIR = fluid-attenuated inversion recovery, GRE = gradient-recalled echo, Inc = increased, Restrict = restricted diffusion, Suscept = susceptibility, T1 = T1-weighted, T1-post = T1-weighted postcontrast.
Comparison of radiologist performance to that of an artificial intelligence (AI) system. A, B, Jitter plots for the accuracy of the AI system for including, A, the correct top three differential diagnoses (T3DDx) and, B, correct top diagnosis (TDx) relative to the different groups of radiologists (radiology residents, general radiologists [General Rad], neuroradiology fellows [Neurorad fellows], and academic neuroradiologists [Academic Neurorads]). C, Nonparametric receiver operating characteristic (ROC) curves for the AI system (blue) compared with groups of radiologists based on their TDx, top two differential diagnoses, and T3DDx for each patient. D, E, Jitter plots for the accuracy of the AI system and radiologists for the, D, T3DDx and, E, exact correct TDx as a function of disease prevalence: common (black circle), moderately rare (gray square) and rare (white triangle). Solid lines denote the mean, and error bars represent standard error of measurement.
Figure 5:
Comparison of radiologist performance to that of an artificial intelligence (AI) system. A, B, Jitter plots for the accuracy of the AI system for including, A, the correct top three differential diagnoses (T3DDx) and, B, correct top diagnosis (TDx) relative to the different groups of radiologists (radiology residents, general radiologists [General Rad], neuroradiology fellows [Neurorad fellows], and academic neuroradiologists [Academic Neurorads]). C, Nonparametric receiver operating characteristic (ROC) curves for the AI system (blue) compared with groups of radiologists based on their TDx, top two differential diagnoses, and T3DDx for each patient. D, E, Jitter plots for the accuracy of the AI system and radiologists for the, D, T3DDx and, E, exact correct TDx as a function of disease prevalence: common (black circle), moderately rare (gray square) and rare (white triangle). Solid lines denote the mean, and error bars represent standard error of measurement.
Confusion matrices for the artificial intelligence system and radiologists. Confusion matrices for different radiologist specialization levels were generated for the top diagnosis, averaged across individuals within each group. True disease labels are shown along the x-axis and predicted diagnoses on the y-axis. The color of each cell represents the fraction of cases within a column where the top predicted diagnosis matched the true diagnosis. Artery of Perch = artery of Percheron, Bilat thal glioma = bilateral thalamic glioma, Carbon Mon Acute = carbon monoxide: acute, Carbon Mon Chronic = carbon monoxide: chronic, Carbon Mon Subacute = carbon monoxide: subacute, CNS = central nervous system, Creutzfeld Jacob = Creutzfeldt-Jakob disease, DVT = deep vein thrombosis, Hemorrhage Chron = hemorrhage: chronic, Hemorrhage Subac = hemorrhage: subacute, High GR = high grade, HIE = hypoxic-ischemic encephalopathy, Infarct Chron = infarct: chronic, Low GR = low grade, Neuro Behcets = neuro Behçet disease, Neurofibromat 1 = neurofibroma type 1, Neurorad fellows = neuroradiology fellows, Neurosarcoid = neurosarcoidosis, Nonketot hypergly = nonketotic hyperglycemia, Wernickes = Wernicke encephalopathy, Wilsons = Wilson disease.
Figure 6:
Confusion matrices for the artificial intelligence system and radiologists. Confusion matrices for different radiologist specialization levels were generated for the top diagnosis, averaged across individuals within each group. True disease labels are shown along the x-axis and predicted diagnoses on the y-axis. The color of each cell represents the fraction of cases within a column where the top predicted diagnosis matched the true diagnosis. Artery of Perch = artery of Percheron, Bilat thal glioma = bilateral thalamic glioma, Carbon Mon Acute = carbon monoxide: acute, Carbon Mon Chronic = carbon monoxide: chronic, Carbon Mon Subacute = carbon monoxide: subacute, CNS = central nervous system, Creutzfeld Jacob = Creutzfeldt-Jakob disease, DVT = deep vein thrombosis, Hemorrhage Chron = hemorrhage: chronic, Hemorrhage Subac = hemorrhage: subacute, High GR = high grade, HIE = hypoxic-ischemic encephalopathy, Infarct Chron = infarct: chronic, Low GR = low grade, Neuro Behcets = neuro Behçet disease, Neurofibromat 1 = neurofibroma type 1, Neurorad fellows = neuroradiology fellows, Neurosarcoid = neurosarcoidosis, Nonketot hypergly = nonketotic hyperglycemia, Wernickes = Wernicke encephalopathy, Wilsons = Wilson disease.

References

    1. Solomon AJ, Bourdette DN, Cross AH, et al. The contemporary spectrum of multiple sclerosis misdiagnosis: A multicenter study. Neurology 2016;87(13):1393–1399. - PMC - PubMed
    1. Tarnutzer AA, Lee SH, Robinson KA, Wang Z, Edlow JA, Newman-Toker DE. ED misdiagnosis of cerebrovascular events in the era of modern neuroimaging: A meta-analysis. Neurology 2017;88(15):1468–1477. - PMC - PubMed
    1. Chowdhury FA, Nashef L, Elwes RD. Misdiagnosis in epilepsy: a review and recognition of diagnostic uncertainty. Eur J Neurol 2008;15(10):1034–1042. - PubMed
    1. Gunderman RB. Biases in radiologic reasoning. AJR Am J Roentgenol 2009;192(3):561–564. - PubMed
    1. Bruno MA, Walker EA, Abujudeh HH. Understanding and Confronting Our Mistakes: The Epidemiology of Error in Radiology and Strategies for Error Reduction. RadioGraphics 2015;35(6):1668–1676. - PubMed