. 2021 May 3;131(9):e142064.
doi: 10.1172/JCI142064.

Melanocortin 4 receptor signals at the neuronal primary cilium to control food intake and body weight

Affiliations

Melanocortin 4 receptor signals at the neuronal primary cilium to control food intake and body weight

Yi Wang et al. J Clin Invest. .

Abstract

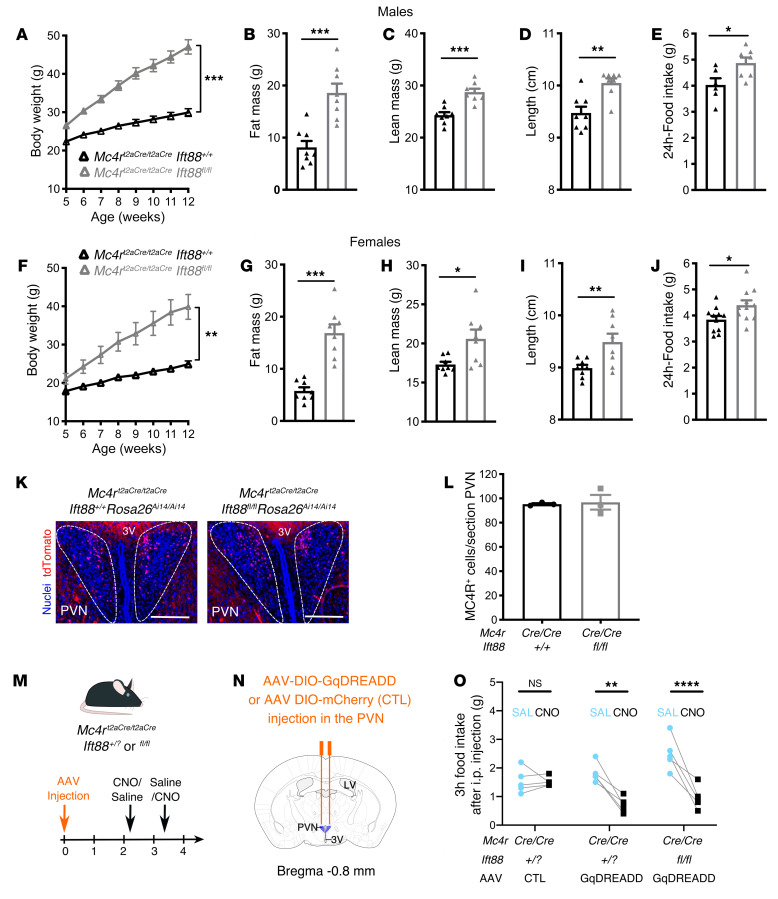
The melanocortin 4 receptor (MC4R) plays a critical role in the long-term regulation of energy homeostasis, and mutations in the MC4R are the most common cause of monogenic obesity. However, the precise molecular and cellular mechanisms underlying the maintenance of energy balance within MC4R-expressing neurons are unknown. We recently reported that the MC4R localizes to the primary cilium, a cellular organelle that allows for partitioning of incoming cellular signals, raising the question of whether the MC4R functions in this organelle. Here, using mouse genetic approaches, we found that cilia were required specifically on MC4R-expressing neurons for the control of energy homeostasis. Moreover, these cilia were critical for pharmacological activators of the MC4R to exert an anorexigenic effect. The MC4R is expressed in multiple brain regions. Using targeted deletion of primary cilia, we found that cilia in the paraventricular nucleus of the hypothalamus (PVN) were essential to restrict food intake. MC4R activation increased adenylyl cyclase (AC) activity. As with the removal of cilia, inhibition of AC activity in the cilia of MC4R-expressing neurons of the PVN caused hyperphagia and obesity. Thus, the MC4R signaled via PVN neuron cilia to control food intake and body weight. We propose that defects in ciliary localization of the MC4R cause obesity in human inherited obesity syndromes and ciliopathies.

Keywords: Endocrinology; G protein–coupled receptors; Melanocortin; Metabolism; Obesity.


Conflict of interest statement

Conflict of interest: The authors have declared that no conflict of interest exists.

Figures

Figure 1
Figure 1. Developmental MC4R subcellular localization in the PVN at postnatal stages P2, P6, P11, and P15 and in adult mice.
Representative immunofluorescence staining of MC4R-GFP (green) and ADCY3 (red) in brain sections from Mc4rgfp/gfp mice during the postnatal period and from adult mice. Nuclei are stained with Hoescht (blue). Arrowheads indicate primary cilia expressing MC4R. A minimum of 3 mice were imaged per age. Scale bar: 20 μm.
Figure 2
Figure 2. Deletion of Ift88 in MC4R-expressing neurons leads to obesity.
(AJ) Phenotyping of control Mc4Rt2aCre/t2aCre Ift88+/+ and Mc4Rt2aCre/t2aCre Ift88fl/fl male (AE) and female (FJ) mice. Body weights of mice were measured weekly from 5 to 12 weeks of age (A and F). Fat mass (B and G) and lean mass (C and H) (measured by EchoMRI) and body length (D and I) were assessed in mice at 12 weeks of age (n = 8 mice per group). (E and J) Twenty-four-hour food intake at 12 weeks of age (females, n = 11 control and n = 11 experimental mice; males, n = 6 control and n = 7 experimental mice). (K) Representative images of the PVN, in which MC4R-expressing neurons express red fluorescent protein (tdTomato) in both Mc4rt2aCre/t2aCre Ift88+/+ (left) and Mc4rt2aCre/t2aCre Ift88fl/fl (right) mice. Scale bars: 200 μm. (L) Quantification of the number of MC4R-expressing neurons in Mc4rt2aCre/t2aCre Ift88+/+ and Mc4rt2aCre/t2aCre Ift88fl/fl mice (n = 3 PVN sections per group, NS). (MO) Chemogenetic activation of MC4R neurons in Mc4rt2aCre/t2aCre Ift88+/+ and Mc4rt2aCre/t2aCre Ift88fl/fl mice. (M) Schematic of the experimental timeline: 7- to 14-week-old male mice were stereotaxically injected with AAV DIO-GqDREADD or AAV DIO-mCherry and then tested either for CNO or saline 2 weeks and 3 weeks after injection, using a randomized crossover design. (N) Schematic of bilateral stereotaxic injections (coordinates: AP = –0.8, ML = ±0.25, DV = –5.2) of AAV DIO-GqDREADD or AAV DIO-mCherry as a control (CTL). (O) Three-hour food intake following injection of saline (SAL) or CNO in 3 groups of mice (n = 5 per group): Mc4rt2aCre/t2aCre Ift88+/? injected with AAV DIO-mCherry (negative control), Mc4rt2aCre/t2aCre Ift88+/? mice injected with AAV DIO-GqDREADD (positive control), and Mc4rt2aCre/t2aCre Ift88fl/fl mice injected with AAV DIO-GqDREADD. Mice were fasted for 24 hours prior to injection. Data represent the mean ± SEM. *P < 0.05, **P < 0.01, ***P < 0.001, and ****P < 0.0001, by Student’s t test (BE, GJ, and L) or repeated-measures 2-way ANOVA followed by Sidak’s multiple-comparison test (A, F, and O). 3V, third ventricle; LV, lateral ventricle.
Figure 3
Figure 3. Time course of metabolic changes following ablation of primary cilia in adult mice.
(A) Schematic of the experimental protocol. (B) Time course of body weight changes for 20-week-old male Ubc-Cre-Ert2 Ift88fl/fl (n = 8) and Ift88fl/fl (n = 4) mice at baseline and at the indicated time points after tamoxifen injection. (C) Images of male control (Ift88fl/fl) and Ubc-Cre-Ert2 Ift88fl/fl mice 4 weeks following tamoxifen injection. (D) Fat mass, (E) lean mass (measured by EchoMRI), (F) food intake, and (G) energy expenditure (measured by CLAMS) for Ubc-Cre-Ert2 Ift88fl/fl versus Ift88fl/fl male mice at the indicated time points after tamoxifen injection. Data represent the mean ± SEM. *P < 0.05, **P < 0.01, and ****P < 0.0001, by 2-way ANOVA followed by Sidak’s multiple-comparison test (B and DF). Energy expenditure in G was analyzed by CalR ANCOVA, with body weight included as a covariate. Tx, tamoxifen.
Figure 4
Figure 4. Primary cilia are essential for the response to the MC4R agonist MTII.
(A) Schematic of the placement of an i.c.v. cannula in the lateral ventricle (coordinates: AP = –0.3, ML = +1, DV = –2.5). (B) Schematic of the experimental protocol. Control (Ift88fl/fl) and Ubc-Cre-Ert2 Ift88fl/fl littermate (n = 6 per group) mice over 20 weeks of age were implanted with an i.c.v. cannula in the lateral ventricle. After recovery, food intake was measured following i.c.v. delivery of MTII or vehicle control (aCSF). Mice were then injected with tamoxifen for 5 days, and the response to i.c.v. delivered MTII was measured again 2, 11, and 18 days after the last tamoxifen injection. (C) Body weights of Ift88fl/fl control and Ubc-Cre-Ert2 Ift88fl/fl littermate mice during the experiment. (D) Assessment of the anorexigenic effect of MTII (0.5 nmol) on short-term food intake (4 hours) compared with vehicle (aCSF) before and after primary cilia loss. Mice were fasted for 24 hours prior to injection. *P < 0.05, by 2-way ANOVA (C) and unpaired Student’s t test (D). Data represent the mean ± SEM.
Figure 5
Figure 5. Primary cilia are required in PVN neurons for weight control and sensitivity to MC4R agonists.
(A) Schematic of the experimental protocol. Bilateral stereotaxic injections (coordinates: AP = –0.8, ML = ±0.2, DV = –5.2) of AAV-CreGFP or AAV-nGFP were performed on 20-week-old Ift88fl/fl mice. (B) Schematic representation of the hypothalamic region studied. (C and D) Representative images of PVN sections from AAV-CreGFP- or AAV-nGFP–injected mice showing AAV-infected cells in green and nuclei in blue. Scale bars: 200 μm. Enlarged insets show immunofluorescence images of primary cilia (ADCY3, magenta) in the PVN regions shown in C and D. Arrows indicate cilia. Scale bars: 10 μm. (E) Body weights of Ift88fl/fl mice following bilateral PVN injection of AAV-CreGFP (n = 5) or AAV-nGFP (n = 5). (F) Body weights at the time of AAV injection and 1 month later. Individual mice are indicated by lines. (G) Schematic of the experimental protocol for testing the anorexigenic effects of the MC4R agonist MTII. Three weeks after AAV injection and cannulation, 20-week-old Ift88fl/fl mice were alternately treated with vehicle (aCSF) or MTII by i.c.v. infusion after fasting for 24 hours, with a 4-day recovery between infusions. Food intake during a 4-hour re-feeding period was then averaged for aCSF and MTII (values are shown in I and J). (H) Schematic of bilateral stereotaxic injections (coordinates: AP = –0.8, ML = ±0.2, DV = –5.5) of AAV-CreGFP (n = 9) or AAV-nGFP (n = 6), and placement of an i.c.v. cannula in the lateral ventricle (coordinates: AP = –0.3, ML = +1, DV = –2.5). (I) Four-hour food intake following injection of aCSF or MTII into AAV-CreGFP– and control AAV-nGFP–injected Ift88fl/fl mice (repeated-measures averaged). (J) Percentage of food ingested within 4 hours following i.c.v. administration of MTII normalized to aCSF administration. Data represent the mean ± SEM. *P < 0.05, **P < 0.01, ***P < 0.001, and ****P < 0.0001, by Student’s t test (J) and repeated-measures 2-way ANOVA followed by Sidak’s multiple-comparison test (E, F, and I).
Figure 6
Figure 6. Inhibition of ciliary AC causes hyperphagia and obesity.
(A) Schematic of the experimental protocol and midline stereotaxic injections of AAV DIO-mCherry without (CTL) or with AAV DIO-Flag-GPR88* (GPR88) into 18-week-old Mc4rt2aCre/t2aCre male mice. (B) Sections of PVN from GPR88-treated mice showing nuclei (cyan) and mCherry (magenta), indicating the region of viral transfection. Scale bar: 200 μm. (C) Enlarged immunofluorescence inset images from B showing cilia (ADCY3, magenta), Flag-GPR88* (yellow), and nuclei (cyan). Scale bar: 20 μm. (D) Enlarged inset images from C depicting GPR88 localization to individual cilia. Scale bars: 5 μm. (E) Body weight change of mice treated with GPR88 (n = 8) or control (n = 13) over a 9-week period following AAV injection. (F) Body weight at the time of AAV injection and 9 weeks later. Lines connect individual mice. Lean mass (G) and fat mass (H) gain over the 9 weeks following AAV injection. (I) Twenty-four-hour food intake at the time of AAV injection and 3 weeks later. (J) Average hourly energy expenditure during the light phase, dark phase, and full day for mice treated with GPR88 (n = 5) or control (n = 9) three weeks after AAV injection. (K) Schematic of bilateral injections of AAV DIO-mCherry (CTL) (n = 10) with or without AAV DIO-Flag-GPR88* (n = 8) or control AAV, and placement of an i.c.v. cannula in 8- to 11-week-old Mc4rt2aCre/t2aCre male mice. (L) Schematic of the experimental protocol for testing the anorexigenic effect of MTII. Mice were fasted for 24 hours and infused i.c.v. with vehicle (aCSF) or MTII (randomized crossover design, 2 and 3 weeks following surgery). (M) Four-hour food intake following infusion of aCSF or MTII into AAV GPR88– and control AAV–injected mice. Data represent the mean ± SEM. *P < 0.05, **P < 0.01, ***P < 0.001, and ****P < 0.0001, by repeated-measures 2-way ANOVA followed by Sidak’s multiple-comparison test (E, GI, and M). Energy expenditure in J was analyzed by ANCOVA, with body weight included as a covariate.

References

    1. Singla V, Reiter JF. The primary cilium as the cell’s antenna: signaling at a sensory organelle. Science. 2006;313(5787):629–633. doi: 10.1126/science.1124534. - DOI - PubMed
    1. Reiter JF, Leroux MR. Genes and molecular pathways underpinning ciliopathies. Nat Rev Mol Cell Biol. 2017;18(9):533–547. doi: 10.1038/nrm.2017.60. - DOI - PMC - PubMed
    1. Saeed S, et al. Loss-of-function mutations in ADCY3 cause monogenic severe obesity. Nat Genet. 2018;50(2):175–179. doi: 10.1038/s41588-017-0023-6. - DOI - PubMed
    1. Shalata A, et al. Morbid obesity resulting from inactivation of the ciliary protein CEP19 in humans and mice. Am J Hum Genet. 2013;93(6):1061–1071. doi: 10.1016/j.ajhg.2013.10.025. - DOI - PMC - PubMed
    1. Wang Z, et al. Adult type 3 adenylyl cyclase-deficient mice are obese. PLoS One. 2009;4(9):e6979. doi: 10.1371/journal.pone.0006979. - DOI - PMC - PubMed

Publication types

Substances