. 2021 May;20(5):e13344.
doi: 10.1111/acel.13344. Epub 2021 May 3.

Senescence-associated β-galactosidase reveals the abundance of senescent CD8+ T cells in aging humans

Affiliations

Senescence-associated β-galactosidase reveals the abundance of senescent CD8+ T cells in aging humans

Ricardo I Martínez-Zamudio et al. Aging Cell. 2021 May.

Abstract

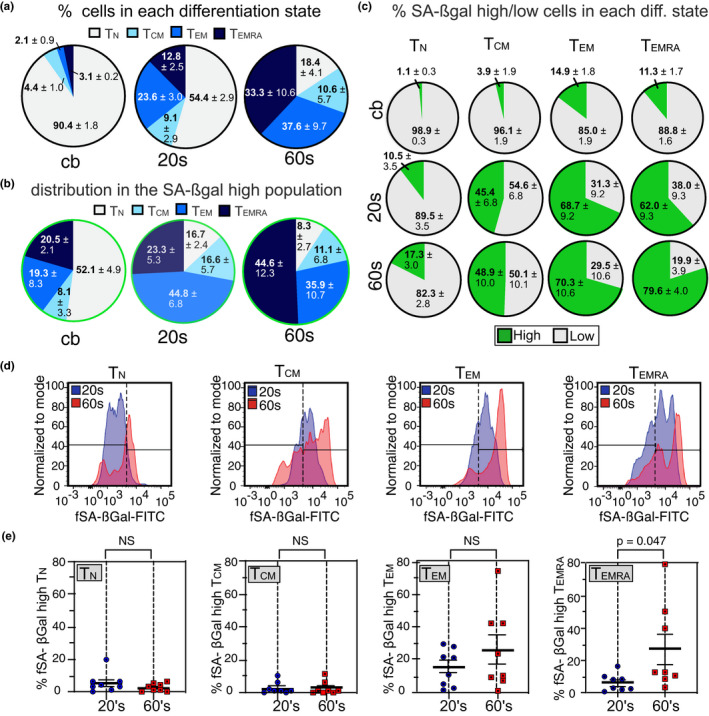
Aging leads to a progressive functional decline of the immune system, rendering the elderly increasingly susceptible to disease and infection. The degree to which immune cell senescence contributes to this decline remains unclear, however, since markers that label immune cells with classical features of cellular senescence accurately and comprehensively have not been identified. Using a second-generation fluorogenic substrate for β-galactosidase and multi-parameter flow cytometry, we demonstrate here that peripheral blood mononuclear cells (PBMCs) isolated from healthy humans increasingly display cells with high senescence-associated β-galactosidase (SA-βGal) activity with advancing donor age. The greatest age-associated increases were observed in CD8+ T-cell populations, in which the fraction of cells with high SA-βGal activity reached average levels of 64% in donors in their 60s. CD8+ T cells with high SA-βGal activity, but not those with low SA-βGal activity, were found to exhibit features of telomere dysfunction-induced senescence and p16-mediated senescence, were impaired in their ability to proliferate, developed in various T-cell differentiation states, and had a gene expression signature consistent with the senescence state previously observed in human fibroblasts. Based on these results, we propose that senescent CD8+ T cells with classical features of cellular senescence accumulate to levels that are significantly higher than previously reported and additionally provide a simple yet robust method for the isolation and characterization of senescent CD8+ T cells with predictive potential for biological age.

Keywords: PBMC; T cells; aging; cellular senescence; immunosenescence; lymphocytes; p16; senescence-associated β-galactosidase; telomere.


Conflict of interest statement

The authors declare that no conflicts of interest exist.

Figures

FIGURE 1
FIGURE 1
Humans display increased percentages of T lymphocytes with high fSA‐βGal signal intensities in advanced age. (a) Experimental strategy to quantify, isolate, and characterize senescent subsets of PBMCs from donors in their 20s and 60s. IF: immunofluorescence analysis. (b) Representative fSA‐ßGal intensity profiles and gates used to quantify fSA‐ßGal high cells for indicated PBMC subsets from a younger (20s, blue) and older (60s, red) donor. (c) Quantification of the percentages of fSA‐ßGal high cells in cord blood (CB), donors in their 20s (blue) and donors in their 60s (red) for indicated PBMC subsets. Whiskers indicate mean ± SEM and are indicated for each subset. Statistical significance was determined by an unpaired, two‐tailed Student's t test. ***p < 0.0001; **p = 0.0005; *p < 0.05; NS: not significant
FIGURE 2
FIGURE 2
CD8+ T cells with high fSA‐βGal signal intensities are senescent. (a) Representative dot plot illustrating gates used to sort and isolate CD8+ T cells by FACS from a donor in their 20s and 60s, as indicated, based on low, inter(med)iate, and high fSA‐βGal signal intensities. (b) Representative Cell Trace Violet histograms of CD8+ T cells, sorted as in (a), following anti‐CD3 and anti‐CD28 stimulation for 5 days from a donor in their 20s and 60s as indicated. Bar graph, quantification of more than two cell divisions of CD8+ T cells from 6 healthy donors (3 donors in their 20s, 3 donors in their 60s) following anti‐CD3 and anti‐CD8 stimulation for 5 days. *p = 0.0002; **p < 0.0001. (c) RT‐qPCR expression profiles for indicated senescence‐associated genes in CD8+ T cells at indicated fSA‐ßGal levels in donors in their 20s (blue) and donors in their 60s (red). Average and SEM of five (CDKN1A and CDKN2A) and three (IL6) independent experiments. Statistical significance was determined by a two‐tailed unpaired t test, with Y‐low as the reference value. *p < 0.05; **p < 0.001; Y: younger donors in their 20s, O: Older donors in their 60s. (d) Immunofluorescence analysis of sorted CD8+ T cells from a donor in their 20s and 60s, as indicated, using antibodies against 53BP1 (green) and p16INK4a (red). Outline of cell nuclei is indicated with white border. Scale bar: 10 μm. (e) Quantification of the percentage of CD8+ T cells positive for 53BP1 foci at each fSA‐ßGal level in younger (n = 8) and older donors (n = 8) combined. Whiskers depict mean ± SEM. Statistical significance was determined by a one‐way ANOVA. **p = 0.001. (f) Sorted CD8+ T cells with high fSA‐βGal signal intensities were simultaneously immunostained using antibodies against 53BP1 (green) and analyzed by FISH to detect telomeres (red). Blue: DAPI. Enlarged versions of the numbered DNA damage foci showing co‐localization with telomeres are shown in the right micrographs. Scale bar: 10 μm. (g) Quantification of mean TIF per cell in sorted CD8+ T cells, as indicated, in donors in their 20s (n = 5) and 60s (n = 5) combined. Whiskers depict mean ± SEM. Statistical significance was calculated by a one‐way ANOVA. *p = 0.0280
FIGURE 3
FIGURE 3
CD8+ T cells with high fSA‐βGal signal intensities develop a gene expression signature that is characteristic of senescent human cells. (a) Principal component analysis on transcriptomes from SA‐βGal high and low CD8 cells isolated from 3 donors in their 20s and 3 donors in their 60s. (b) Expression heatmap of the DEGs within each module across fSA‐ßGal low and high CD8+ T cells. Each column represents an individual donor. Data are represented as Z‐scores. (c) Functional over‐representation map depicting Molecular Signatures Database (MSigDB) hallmark gene sets associated to each transcriptomic cluster. Circles are color‐coded according to the FDR‐corrected p‐value based on the hypergeometric distribution test. (d) Venn diagram portraying the intersections and disjunctive unions of differentially expressed genes in CD8+ T cells with high fSA‐ßGal activity (yellow) and human lung fibroblasts (LF1) that had remained in replicative senescence for 2 months (LF1‐early; green) and 4 months (LF1‐late; red). (e) Representative genome browser visualizations of normalized reads at indicated gene loci in CD8+ T cells sorted based on low and high fSA‐ßGal signal intensities from a representative donor in their 20s and 60s, as indicated, using RNA‐seq. (f) Expression heatmap of a selection of senescence‐associated genes in CD8+ T cells isolated from peripheral blood and sorted based on low (Lo) and high (Hi) fSA‐ßGal signal intensities from younger (Y; 20s) and older (O, 60s) donors and in vitro cultured LF1 fibroblasts in proliferation (P), early (ES; 2 months) and late senescence (LS; 4 months) as in (d). Each column represents the average expression of 3 independent donors (CD8+) and 3 independent experiments (LF1)
FIGURE 4
FIGURE 4
Senescent CD8+ T cells develop primarily in TEM and TEMRA subsets. (a) Distribution (% ± SEM) of indicated T‐cell differentiation states from cord blood (cb; n = 4), young (n = 8) and old (n = 8) donors. (b) Distribution (% ± SEM) of indicated T‐cell differentiation states from cord blood (cb; n = 4), donors in their 20s (n = 8) and donors in their 60s (n = 8) in fSA‐βGal high‐sorted CD8+ T‐cell populations. (c) Fraction of fSA‐βGal low (gray) and fSA‐βGal high (green) cells within indicated CD8+ T‐cell differentiation states from cord blood (top row), donors in their 20s (middle row) and donors in their 60s (bottom row). (d) Representative fSA‐ßGal intensity profiles and gates used to quantify fSA‐ßGal high cells for indicated CD8+ T‐cell differentiation states from a donor in their 20s (blue) and donors in their 60s (red). Gates were set based on the profiles generated by the total CD8+ T‐cell population (e) Quantification of the percentages of fSA‐ßGal high cells in donors in their 20s and 60s for indicated CD8+ T‐cell differentiation states. Statistical significance was determined by an unpaired, two‐tailed Student's t test. NS: not significant
FIGURE 5
FIGURE 5
CD8+ T cells with high fSA‐ßGal signal intensities are phenotypically distinct from exhausted and senescent‐like cells and transcriptionally distinct from TEMRA cells. (a) t‐SNE projections of CD8+ T cells with low (blue) and high (red) fSA‐ßGal signal intensities that were also labeled with indicated cell surface receptors. Gray: CD8+ T cells that immunostained for indicated cell surface antigens but that did not fall into the fSA‐ßGal low or high populations. (b) Venn diagrams portraying the intersections and disjunctive unions of DEGs in fSA‐ßGal high, TCM, TEM, and TEMRA CD8+ T cells. (c) Correlation plot of the log2 fold changes of the DEGs in fSA‐ßGal high and EMRA CD8+ T cells. Dark gray points represent genes expressed in both populations. Turquoise dots are EMRA‐specific genes. Yellow dots are fSA‐ßGal high‐specific genes

Similar articles

Cited by

References

    1. Appay, V. , van Lier, R. A. , Sallusto, F. , & Roederer, M. (2008). Phenotype and function of human T lymphocyte subsets: consensus and issues. Cytometry A, 73, 975–983. - PubMed
    1. Baixauli, F. , Acin‐Perez, R. , Villarroya‐Beltri, C. , Mazzeo, C. , Nunez‐Andrade, N. , Gabande‐Rodriguez, E. , Ledesma, M. D. , Blazquez, A. , Martin, M. A. , Falcon‐Perez, J. M. , Redondo, J. M. , Enriquez, J. A. , & Mittelbrunn, M. (2015). Mitochondrial respiration controls lysosomal function during inflammatory T cell responses. Cell Metabolism, 22, 485–498. - PMC - PubMed
    1. Baker, D. J. , Childs, B. G. , Durik, M. , Wijers, M. E. , Sieben, C. J. , Zhong, J. , Saltness, R. A. , Jeganathan, K. B. , Verzosa, G. C. , Pezeshki, A. , Khazaie, K. , Miller, J. D. , & van Deursen, J. M. (2016). Naturally occurring p16(Ink4a)‐positive cells shorten healthy lifespan. Nature, 530, 184–189. - PMC - PubMed
    1. Bellon, M. , & Nicot, C. (2017). Telomere dynamics in immune senescence and exhaustion triggered by chronic viral infection. Viruses, 9, 289. - PMC - PubMed
    1. Ben‐Porath, I. , & Weinberg, R. A. (2005). The signals and pathways activating cellular senescence. International Journal of Biochemistry & Cell Biology, 37, 961–976. - PubMed

Publication types

Substances