mGPDH Deficiency leads to melanoma metastasis via induced NRF2
- PMID: 33939274
- PMCID: PMC8178277
- DOI: 10.1111/jcmm.16542
mGPDH Deficiency leads to melanoma metastasis via induced NRF2
Abstract
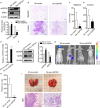
Oxidative stress critically influences carcinogenesis and the progression of melanoma, and aggressive malignant melanoma activity is due to its high metastatic ability. Some findings in several cancer cell lines have indicated that mGPDH, a component of the mitochondrial respiratory chain, also modulates oxidative stress. However, the role of mGPDH in melanoma remains elusive. Here, we report that the mGPDH protein level is decreased in human skin melanoma compared to normal skin and decreased in metastatic melanoma compared to primary melanoma. Our in vivo and in vitro experiments indicated that mGPDH depletion accelerated melanoma migration and invasion without affecting proliferation or apoptosis. Mechanistically, we found elevated NRF2 protein levels in human skin melanoma and mGPDH-knockout (ko) metastatic xenografts in the lungs of nude mice. Moreover, in A375 melanoma cells, the loss of mGPDH-induced NRF2 expression but did not affect NRF2 protein degradation. Additionally, melanoma metastasis induced by the loss of mGPDH was rescued by the further down-regulation of NRF2 in vivo and in vitro. Consistently, mGPDH overexpression (oe) depressed NRF2 expression and attenuated the malignant properties of melanoma cells. In conclusion, our findings suggest that mGPDH suppresses melanoma metastasis by inhibiting NRF2 and downstream oxidative signals, highlighting the therapeutic potential of mGPDH for melanoma treatment.
Keywords: NRF2; mGPDH; melanoma; metastasis.
© 2021 The Authors. Journal of Cellular and Molecular Medicine published by Foundation for Cellular and Molecular Medicine and John Wiley & Sons Ltd.
Conflict of interest statement
The authors have no potential conflicts of interest to declare.
Figures


Similar articles
-
BDH2 triggers ROS-induced cell death and autophagy by promoting Nrf2 ubiquitination in gastric cancer.J Exp Clin Cancer Res. 2020 Jun 30;39(1):123. doi: 10.1186/s13046-020-01620-z. J Exp Clin Cancer Res. 2020. PMID: 32605589 Free PMC article.
-
Deficiency of Mitochondrial Glycerol 3-Phosphate Dehydrogenase Contributes to Hepatic Steatosis.Hepatology. 2019 Jul;70(1):84-97. doi: 10.1002/hep.30507. Epub 2019 Mar 15. Hepatology. 2019. PMID: 30653687 Free PMC article.
-
Knockdown of FBXO22 inhibits melanoma cell migration, invasion and angiogenesis via the HIF-1α/VEGF pathway.Invest New Drugs. 2020 Feb;38(1):20-28. doi: 10.1007/s10637-019-00761-z. Epub 2019 Mar 18. Invest New Drugs. 2020. PMID: 30887251
-
Circular RNA circ_0020710 drives tumor progression and immune evasion by regulating the miR-370-3p/CXCL12 axis in melanoma.Mol Cancer. 2020 May 7;19(1):84. doi: 10.1186/s12943-020-01191-9. Mol Cancer. 2020. PMID: 32381016 Free PMC article.
-
Long non-coding RNA LINC00520 promotes the proliferation and metastasis of malignant melanoma by inducing the miR-125b-5p/EIF5A2 axis.J Exp Clin Cancer Res. 2020 May 28;39(1):96. doi: 10.1186/s13046-020-01599-7. J Exp Clin Cancer Res. 2020. PMID: 32466797 Free PMC article.
Cited by
-
The dual role of Nrf2 in melanoma: a systematic review.BMC Mol Cell Biol. 2023 Feb 6;24(1):5. doi: 10.1186/s12860-023-00466-5. BMC Mol Cell Biol. 2023. PMID: 36747120 Free PMC article.
-
NRF2-directed PRPS1 upregulation to promote the progression and metastasis of melanoma.Front Immunol. 2022 Sep 20;13:989263. doi: 10.3389/fimmu.2022.989263. eCollection 2022. Front Immunol. 2022. PMID: 36203561 Free PMC article.
-
Tangeretin regulates oxidative stress in cutaneous melanoma cells via the Nrf2 signaling pathway.Arch Dermatol Res. 2025 Mar 12;317(1):550. doi: 10.1007/s00403-025-03958-w. Arch Dermatol Res. 2025. PMID: 40072600
-
Glycerol 3-phosphate dehydrogenases (1 and 2) in cancer and other diseases.Exp Mol Med. 2024 May;56(5):1066-1079. doi: 10.1038/s12276-024-01222-1. Epub 2024 May 1. Exp Mol Med. 2024. PMID: 38689091 Free PMC article. Review.
References
-
- Shain AH, Bastian BC. From melanocytes to melanomas. Nat Rev Cancer. 2016;16(6):345‐358. - PubMed
-
- Azoury SC, Lange JR. Epidemiology, risk factors, prevention, and early detection of melanoma. Surg Clin North Am. 2014;94(5):945‐962. - PubMed
-
- Wang H, Liu X, Long M, et al. NRF2 Activation by antioxidant antidiabetic agents accelerates tumor metastasis. Sci Transl Med. 2016;8(334):334ra51. - PubMed
-
- Obrador E, Liu‐Smith F, Dellinger RW, Salvador R, Meyskens FL, Estrela JM. Oxidative stress and antioxidants in the pathophysiology of malignant melanoma. Biol Chem. 2019;400(5):589‐612. - PubMed
Publication types
MeSH terms
Substances
Grants and funding
LinkOut - more resources
Full Text Sources
Other Literature Sources
Medical
Molecular Biology Databases
Research Materials

