. 2021 May 3;17(5):e1008948.
doi: 10.1371/journal.pcbi.1008948. eCollection 2021 May.

Small subpopulations of β-cells do not drive islet oscillatory [Ca2+] dynamics via gap junction communication

Affiliations

Small subpopulations of β-cells do not drive islet oscillatory [Ca2+] dynamics via gap junction communication

JaeAnn M Dwulet et al. PLoS Comput Biol. .

Abstract

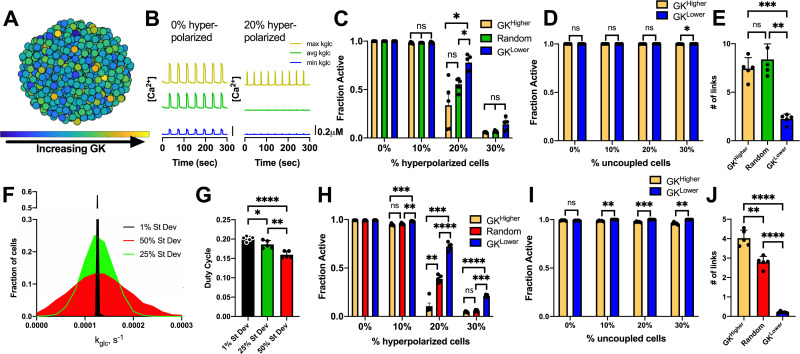
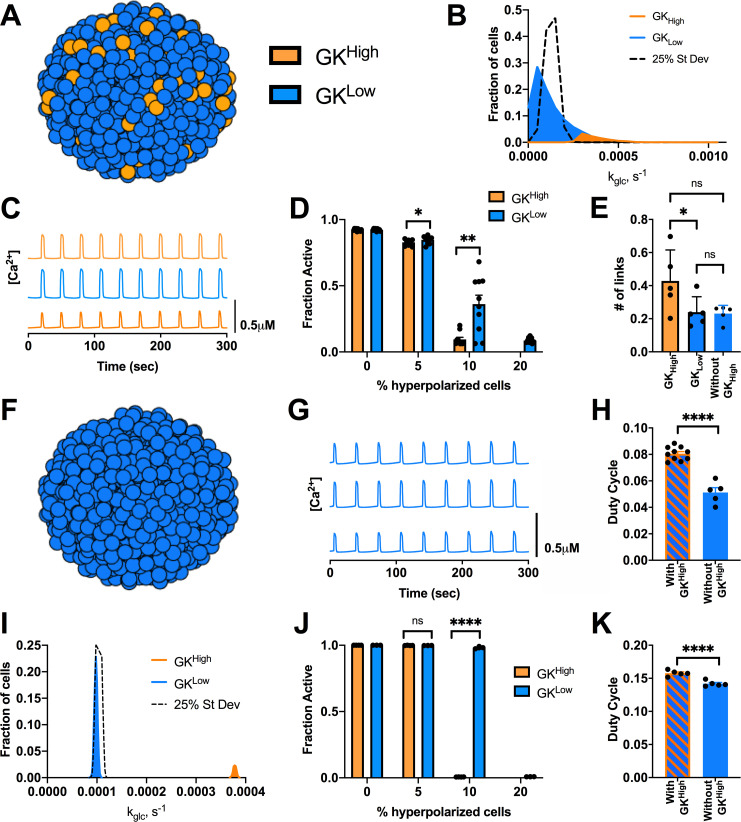
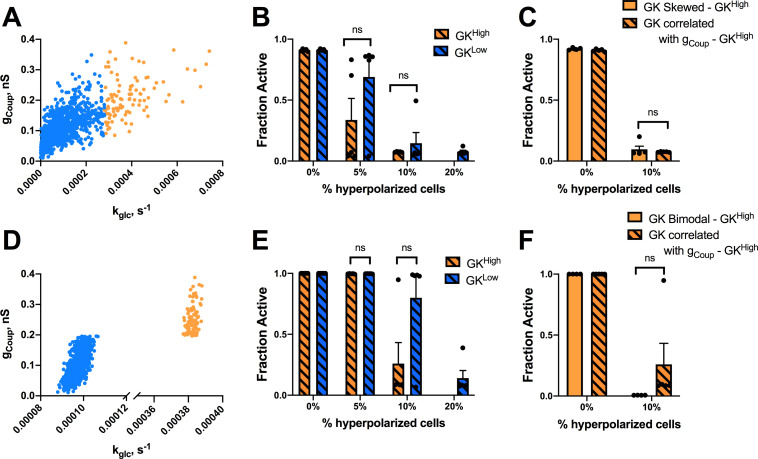
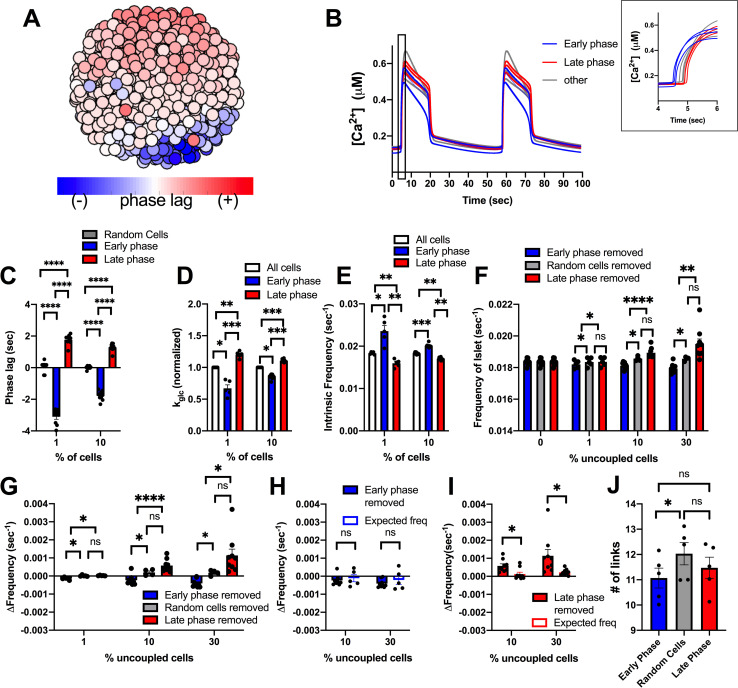
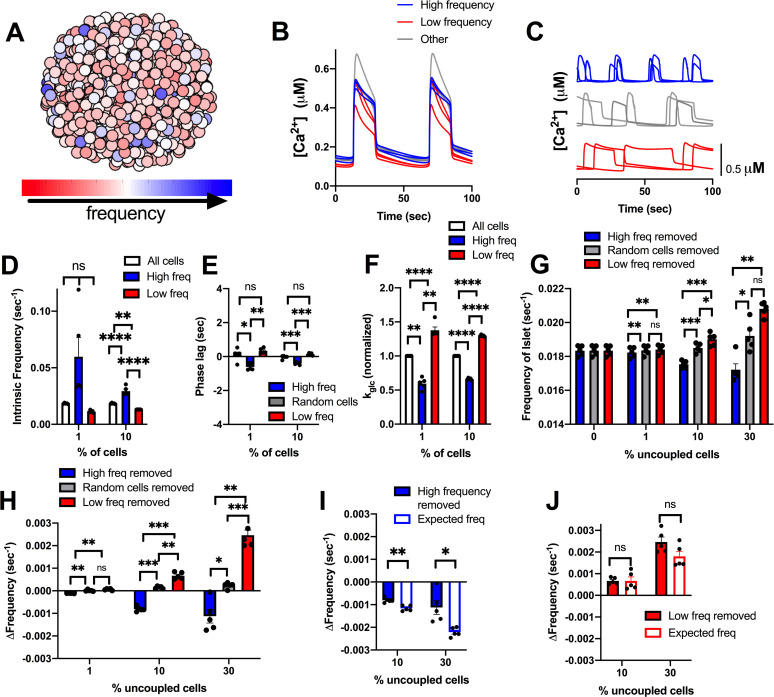
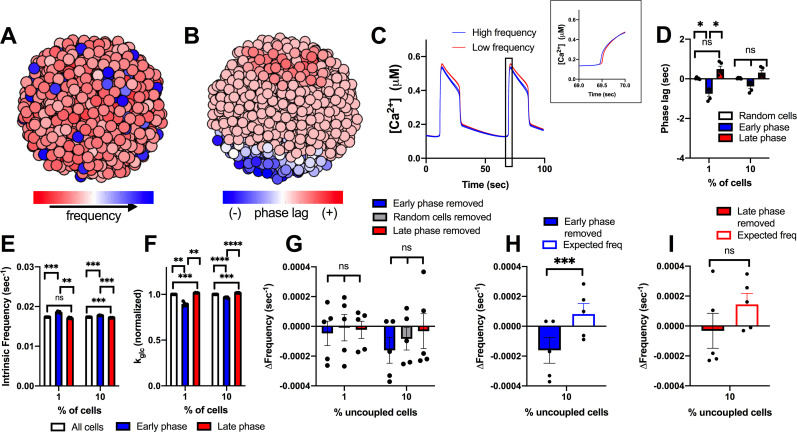
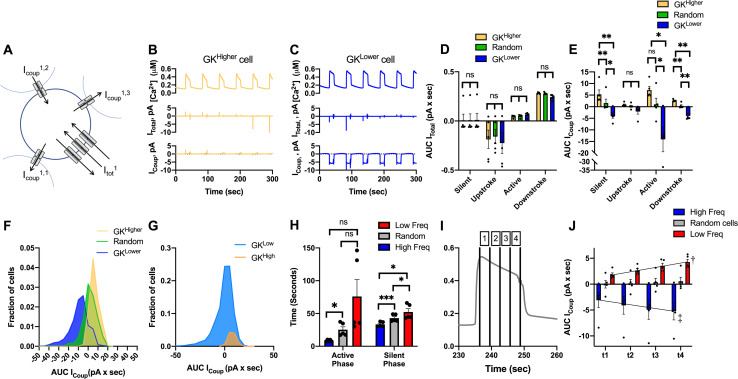
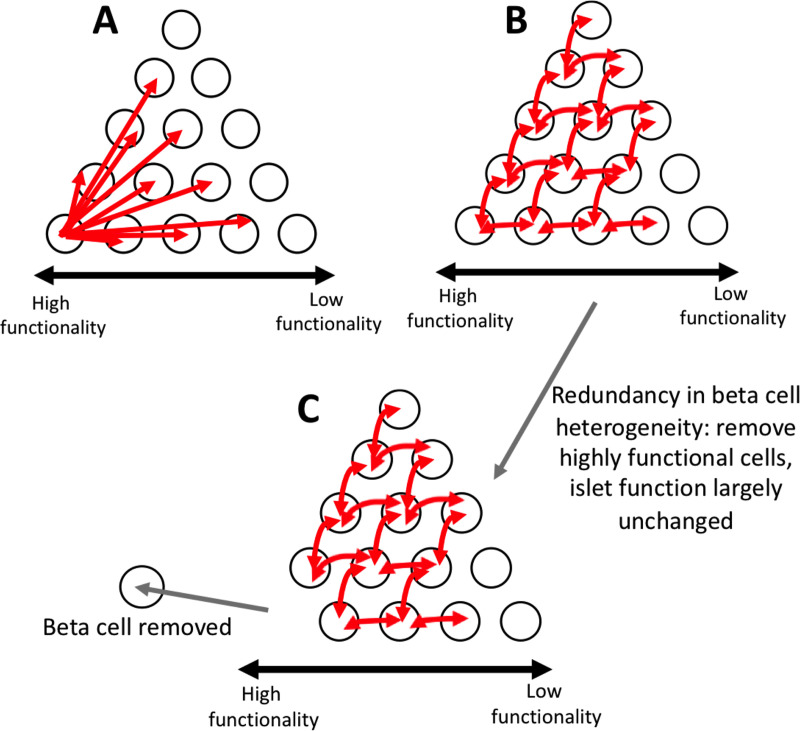
The islets of Langerhans exist as multicellular networks that regulate blood glucose levels. The majority of cells in the islet are excitable, insulin-producing β-cells that are electrically coupled via gap junction channels. β-cells are known to display heterogeneous functionality. However, due to gap junction coupling, β-cells show coordinated [Ca2+] oscillations when stimulated with glucose, and global quiescence when unstimulated. Small subpopulations of highly functional β-cells have been suggested to control [Ca2+] dynamics across the islet. When these populations were targeted by optogenetic silencing or photoablation, [Ca2+] dynamics across the islet were largely disrupted. In this study, we investigated the theoretical basis of these experiments and how small populations can disproportionality control islet [Ca2+] dynamics. Using a multicellular islet model, we generated normal, skewed or bimodal distributions of β-cell heterogeneity. We examined how islet [Ca2+] dynamics were disrupted when cells were targeted via hyperpolarization or populations were removed; to mimic optogenetic silencing or photoablation, respectively. Targeted cell populations were chosen based on characteristics linked to functional subpopulation, including metabolic rate of glucose oxidation or [Ca2+] oscillation frequency. Islets were susceptible to marked suppression of [Ca2+] when ~10% of cells with high metabolic activity were hyperpolarized; where hyperpolarizing cells with normal metabolic activity had little effect. However, when highly metabolic cells were removed from the model, [Ca2+] oscillations remained. Similarly, when ~10% of cells with either the highest frequency or earliest elevations in [Ca2+] were removed from the islet, the [Ca2+] oscillation frequency remained largely unchanged. Overall, these results indicate small populations of β-cells with either increased metabolic activity or increased frequency are unable to disproportionately control islet-wide [Ca2+] via gap junction coupling. Therefore, we need to reconsider the physiological basis for such small β-cell populations or the mechanism by which they may be acting to control normal islet function.


Conflict of interest statement

The authors have declared that no competing interests exist.

Figures

Fig 1
Fig 1. Simulations predicting how variation in GK activity impact islet function.
A). Schematic of unimodal normal distribution of heterogeneous GK activity across simulated islet with 25% variation in GK rate (kglc). B). Representative time courses of [Ca2+] for 3 cells in simulated islet in A. Left is simulation with 0% hyperpolarized cells and right is simulation with a random 20% of cells hyperpolarized. Blue trace is cell with lowest GK rate (kglc), Green is cell with the average GK rate, yellow is cell with the highest GK rate. C). Fraction of cells showing elevated [Ca2+] activity (active cells) in simulated islets vs. the percentage of cells hyperpolarized in islet. Hyperpolarized cells are chosen based on their GK rate. D). Fraction of active cells in islet when cells are uncoupled from the rest of the cells in the simulation. E). # of links from network analysis of [Ca2+] activity with GK 25% variation. F). Histogram showing average frequency of cells at varying GK rate (kglc) for simulations that have different standard deviation in GK activity. G). Average duty cycle of cells from simulations with different standard deviation in GK activity. H). As in C. for simulations with standard deviation in GK activity at 50% of the mean. I). As in D. for simulations with standard deviation in GK activity at 50% of the mean. J). As in E but for simulations with GK 50% variation. Error bars are mean ± s.e.m. Repeated measures one-way ANOVA with Tukey post-hoc analysis was performed for simulations in C and G, Student’s paired t-test was performed for D and H, and one-way ANOVA was performed for F to test for significance. Significance values: ns indicates not significant (p>.05), * indicates significant difference (p < .05), ** indicates significant difference (p < .01), *** indicates significant difference (p < .001), **** indicates significant difference (p < .0001). Data representative of 5 simulations with differing random number seeds.
Fig 2
Fig 2. Alternative distributions in GK activity predicts small highly functional cells are dispensable for islet [Ca2+] dynamics.
A). Schematic of altered distributions of GK activity across simulated islet. B). Histogram showing average frequency of cells at varying GK rate (kglc) for skewed distribution compared with normal distribution (25% St Dev). C). Representative time courses of [Ca2+] for 3 cells in simulated skewed islet in A. Blue traces are cells from GKLow population and orange traces are cells from GKHigh population. D). Fraction of cells showing elevated [Ca2+] activity (active cells) in skewed simulations vs. the percentage of cells hyperpolarized in islet. Hyperpolarized cells are chosen either from GKHigh (orange bars) or GKLow (blue bars) population. E). # of links from network analysis of [Ca2+] activity for simulations with skewed distribution of GK F). Schematic of simulation where only GKLow cells are present and no GKHigh cells are included. G). Representative time courses of [Ca2+] for 3 cells in simulated islet in F. H). Average duty cycle of cells from simulations of a skewed distribution model as in A (With GKHigh) and from simulations as in F (Without GKHigh). I). As in B. for bimodal distribution in GK activity where the populations only have 2.5% variation in GK activity. J). As in D. for bimodal distribution in GK activity. K). As in H. but for simulations with no GKHigh from a bimodal distribution. Error bars are mean ± s.e.m. Student’s paired t-test was performed to test for significance. Significance values: ns indicates not significant (p>.05), * indicates significant difference (p < .05), ** indicates significant difference (p < .01), *** indicates significant difference (p < .001), **** indicates significant difference (p < .0001). Data representative of 4–9 simulations with differing random number seeds.
Fig 3
Fig 3. Simulations predicting how changes in coupling impact highly metabolic populations.
A). Scatterplot of gCoup vs. kglc for each cell from a representative simulation where gCoup is correlated with kglc under a skewed distribution in GK activity. B). Fraction of cells showing elevated [Ca2+] activity (active cells) vs. the percentage of cells hyperpolarized in islet from skewed simulations in kglc with correlated gCoup and kglc as in A. Hyperpolarized cells are chosen either from GKHigh (orange bars) or GKLow (blue bars) population. C). As in B. but comparing hyperpolarization in GKHigh cells in the presence and absence of correlations in gCoup. D). as in A but from a simulation where gCoup and kglc are correlated under a bimodal distribution in GK activity. E). As in B. but for simulations where gCoup and kglc are correlated under a bimodal distribution in GK activity. F). As in C. but comparing hyperpolarization in GKHigh cells in the presence and absence of correlations in gCoup under a bimodal distribution in GK activity. Error bars are mean ± s.e.m. Student’s paired t-test was performed for B and E and a Welches t-test for unequal variances was used for C and F to test for significance. Significance values: ns indicates not significant (p>.05), * indicates significant difference (p < .05), ** indicates significant difference (p < .01), *** indicates significant difference (p < .001), **** indicates significant difference (p < .0001). Data representative of 4 simulations with differing random number seeds.
Fig 4
Fig 4. Simulations predicting how small populations of cells contribute to islet frequency.
A). Schematic of phase lag across simulated islet with 25% variation in GK activity. B). Representative time courses of [Ca2+] for 9 cells in simulated islet at 60pS coupling conductance to determine phase lag of cells in A. Blue traces are early phase cells (negative phase lag), Grey is non early or late phase cells, red is late phase cells (positive phase lag). Inset: Close up of rise of [Ca2+] oscillation showing phase lags. C). Phase lag from islet average of top 1% or 10% of early phase, late phase cells, or random cells. D). Average kglc from all cells, early phase cells or late phase cells across simulated islet (normalized to average kglc). E). Average intrinsic oscillation frequencies of all cells, top 1% and 10% of early phase cells, or top 1% or 10% of late phase cells when re-simulated in the absence of gap junction coupling (0pS). F). Average frequency of islet when indicated populations of cells are removed from the simulated islet. G). Change in frequency of islet with indicated populations removed with respect to control islet with all cells present. H). Change in frequency when early phase cells are removed compared to average oscillation frequency of remaining cells that indicates the expected oscillation frequency. I). Same as H. but for simulations where late phase cells are removed. J). # of links from network analysis for early phase, late phase, and random cells in simulations. Error bars are mean ± s.e.m. Repeated measures one-way ANOVA with Tukey post-hoc analysis was performed for simulations in C-G (if there were any missing values a mixed effects model was used), Student’s paired t-test was performed for H and I to test for significance. Significance values: ns indicates not significant (p>.05), * indicates significant difference (p < .05), ** indicates significant difference (p < .01), *** indicates significant difference (p < .001), **** indicates significant difference (p < .0001). Data representative of 4–9 simulations with differing random number seeds. Random regions were removed for 10% and 30% simulations, but random removal of cells was used for 1% simulations.
Fig 5
Fig 5. Simulations predicting how intrinsic frequency of cells contributes to islet frequency.
A). Schematic of frequency across simulated islet with 25% variation in GK activity. B). Representative time courses of [Ca2+] for 9 cells in simulated islet in A in a simulation with full (120pS) coupling conductance. Blue traces are high frequency cells, Grey are cells with frequency near average frequency, red traces are low frequency cells. C). Same cells as in B but showing [Ca2+] time courses from an uncoupled simulation (0pS coupling conductance). D). Average intrinsic oscillation frequencies of all cells, top 1% or 10% of high frequency cells, or low frequency cells when re-simulated in the absence of gap junction coupling. E). Phase lag from islet average of top 1% or 10% of low frequency, high frequency, or random cells. F). Average kglc from all cells, high frequency cells, or low frequency cells across simulated islet (normalized to average kglc). G). Average frequency of islet when indicated populations of cells are removed from the simulated islet. H). Change in frequency of islet with indicated populations removed with respect to control islet with all cells present. I). Change in frequency when high frequency cells are removed compared to average oscillation frequency of remaining cells that indicates the expected oscillation frequency. J). Same as I. but for simulations where low frequency cells are removed. Error bars are mean ± s.e.m. Repeated measures one-way ANOVA with Tukey post-hoc analysis was performed for simulations in D-H and a Student’s paired t-test was performed for I and J to test for significance. Significance values: ns indicates not significant (p>.05), * indicates significant difference (p < .05), ** indicates significant difference (p < .01), *** indicates significant difference (p < .001), **** indicates significant difference (p < .0001). Data representative of 5 simulations with differing random number seeds. Random removal of cells across the islet was used for all simulations where random cells removed is indicated.
Fig 6
Fig 6. Simulations predicting how cells from a bimodal distribution characterized by early phase cells contribute to islet frequency.
A). Schematic of frequency across simulated islet with a bimodal distribution in GK activity. B). Schematic of phase lag across simulated islet with a bimodal distribution in GK activity. C). Representative time courses of [Ca2+] for 6 cells in simulated islet in A (and B) in a simulation with full (120pS) coupling conductance. Blue traces are high frequency cells, red traces are low frequency cells. Inset: Close up of rise of [Ca2+] oscillation showing phase lags. D). Phase lag from islet average of top 1% or 10% of early phase, late phase cells, or random cells. E). Average intrinsic oscillation frequencies of all cells and 1% or 10% of early phase cells, or 1% or 10% of late phase cells when re-simulated in the absence of gap junction coupling (0pS). F). Average kglc from all cells and top 1% or 10% of early phase cells or late phase cells across simulated islet (normalized to average kglc). G). Change in frequency of islet with indicated populations removed with respect to control islet with all cells present. H). Change in frequency when early phase cells are removed compared to average oscillation frequency of remaining cells that indicates the expected oscillation frequency. I). Same as H. but for simulations where late phase cells are removed. Repeated measures one-way ANOVA with Tukey post-hoc analysis was performed for simulations in D-G and a Student’s paired t-test was performed for H and I to test for significance. Error bars are mean ± s.e.m. Significance values: ns indicates not significant (p>.05), * indicates significant difference (p < .05), ** indicates significant difference (p < .01), *** indicates significant difference (p < .001), **** indicates significant difference (p < .0001). Data representative of 5 simulations with differing random number seeds. Random removal of cells across the islet was used where random cells removed is indicated.
Fig 7
Fig 7. Gap junction current in cells with high/low metabolic activity or oscillation frequency.
A). Schematic of cell within the simulated islet, showing 3 gap junction currents that contribute to the total gap junction current, together with the total membrane current. B). Time course of [Ca2+] from a cell, together with the total membrane current and total gap junction current for a representative cell with higher metabolic activity (kglc). C). As in B for a representative cell with lower metabolic activity. D). Total membrane current, as expressed by an area under the curve (AUC), for each phase of the [Ca2+] oscillation averaged over the 10% of cells with highest or lowest kglc or a random 10% of cells. E). As in D for total gap junction current. F). Distribution of total gap junction current, as expressed by AUC, for the 10% of cells with highest or lowest kglc or a random 10% of cells. G). As in E for a bimodal distribution in kglc. H). Mean duration of active phase and silent phase averaged over the 10% of cells with highest or lowest oscillation frequency, or a random 10% of cells. I). Mean islet [Ca2+] time course showing different portions of the active phase (1–4). J). Mean islet gap junction current during different portions of the active phase, as indicated in I for the 10% of cells with highest or lowest oscillation frequency, or a random 10% of cells. Black lines are fitted regression lines. Error bars are mean ± s.e.m. Repeated measures one-way ANOVA was performed for data in D, E, H to test for significance. Linear regression was performed on data in J. Significance values: ns indicates not significant (p>.05), * indicates significant difference (p < .05), ** indicates significant difference (p < .01), *** indicates significant difference (p < .001), **** indicates significant difference (p < .0001), † indicates significant linear regression (p < .05), ‡ indicated significant linear regression (p < .01). Data representative of 5 simulations with differing random number seeds.
Fig 8
Fig 8. Schematic of multicellular dynamics of the islet.
A). Schematic of suggestion that small subpopulations of highly functional cells can control whole islet dynamics. White circles represent β-cells. Red arrows represent which cells can be controlled by individual cell where the arrow begins. Increasing functionality in cells is from right to left B). Same as A, but a schematic of how our simulations predict islet [Ca2+] dynamics are controlled. Our simulations predict that control is redundant, and many cells can control many other cells. Our simulations predict there is not one small subpopulation that controls the entire islet. C). Same as B, but schematic of how our simulations predict the islet responds when highly functional subpopulations are removed. When highly functional subpopulations are removed, the remaining cells are able to maintain the function of the islet due to the redundancy in control.

Similar articles

Cited by

References

    1. Jackson MDB, Duran-Nebreda S, Bassel GW. Network-based approaches to quantify multicellular development. J R Soc Interface. 2017;14(135). 10.1098/rsif.2017.0484 - DOI - PMC - PubMed
    1. Kulkarni RN. The islet beta-cell. Int J Biochem Cell Biol. 2004;36(3):365–71. 10.1016/j.biocel.2003.08.010 - DOI - PubMed
    1. Alberti KG, Zimmet PZ. Definition, diagnosis and classification of diabetes mellitus and its complications. Part 1: diagnosis and classification of diabetes mellitus provisional report of a WHO consultation. Diabet Med. 1998;15(7):539–53. 10.1002/(SICI)1096-9136(199807)15:7&lt;539::AID-DIA668&gt;3.0.CO;2-S - DOI - PubMed
    1. Thorens B, Guillam MT, Beermann F, Burcelin R, Jaquet M. Transgenic reexpression of GLUT1 or GLUT2 in pancreatic beta cells rescues GLUT2-null mice from early death and restores normal glucose-stimulated insulin secretion. J Biol Chem. 2000;275(31):23751–8. 10.1074/jbc.M002908200 - DOI - PubMed
    1. Thorens B. GLUT2, glucose sensing and glucose homeostasis. Diabetologia. 2015;58(2):221–32. 10.1007/s00125-014-3451-1 - DOI - PubMed

Publication types

MeSH terms

LinkOut - more resources