

The European tomato market. An approach by export competitiveness maps
- PMID: 33939759
- PMCID: PMC8092757
- DOI: 10.1371/journal.pone.0250867
The European tomato market. An approach by export competitiveness maps
Abstract
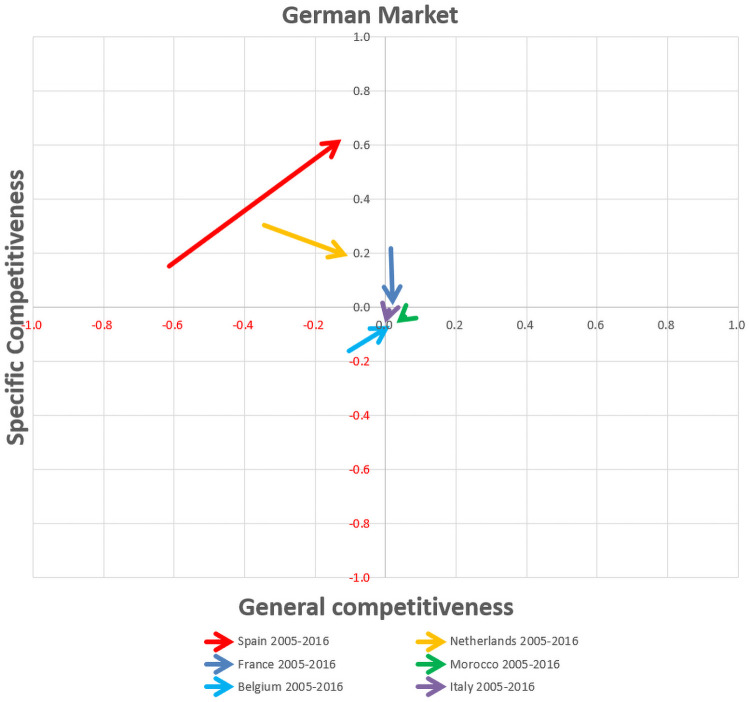
Most empirical studies examining the export competitiveness of a country in a target market are undertaken by focusing on supply, only analysing the group of competing countries. In addition, if the target market to be analysed is extensive, like the European Union, it is generally analysed as a whole. This study presents an evaluation of the tomato export competitiveness, from a differentiated demand perspective, analysing its main customers markets in the context of European Union. The methodological framework is implemented through Constant Market Share to analyze variations in exports, allowing the portion attributable to competitiveness and segregation into general or specific competitiveness to be quantified. The Constant Market Share was adapted to focus on the differentiated demand so as to observe the influence of the worldwide crisis (2007/08) on the European tomato market. This study allows the analysis of profile changes into the competitor exporting economies. As a contribution to the methodology, this study presents a new graphical way of representing the results of Constant Market Share methodology by means of export competitiveness maps in the European tomato market for the group for each main competitor in each European client market. According to our results, Spain and Belgium are candidate countries to be competitive in the main European markets.
Conflict of interest statement
The authors have declared that no competing interests exist.
Figures


References
-
- Organization for Economic Co-operation and Development and the Food and Agriculture Organization. Agricultural Outlook report 2014–2023. 2014. http://www.fao.org/3/a-i3818e.pdf [31/01/2019].
-
- Van Rijswick, C. World Vegetable Map 2018: More than Just a Local Affair. Rabobank Report. 2018. https://research.rabobank.com/far/en/sectors/regional-food-agri/world_ve... [30/08/2018].
-
- Capobianco-Uriarte M.M., Aparicio J. & De Pablo-Valenciano J. Analysis of Spain´s competitiveness in the European tomato market: An application of the Constant Market Share method. Journal of Spanish Agricultural Research. 2017; 15:1.
-
- Porter M. The Competitive Advantages of Nations. Harvard Business Review March-April. 1990: 73–91.
-
- Fideicomisos Instituidos en Relación con la Agricultura. Panorama agroalimentario–Tomate rojo. Direecion de investigación y evaluación económica y sectorial. 2016. https://www.gob.mx/cms/uploads/attachment/file/200635/Panorama_Agroalime....
Publication types
MeSH terms
LinkOut - more resources
Full Text Sources
Other Literature Sources
Research Materials
