. 2021 May 19;12(10):1811-1823.
doi: 10.1021/acschemneuro.1c00103. Epub 2021 May 3.

Integration of Mass Spectrometry Imaging and Machine Learning Visualizes Region-Specific Age-Induced and Drug-Target Metabolic Perturbations in the Brain

Affiliations

Integration of Mass Spectrometry Imaging and Machine Learning Visualizes Region-Specific Age-Induced and Drug-Target Metabolic Perturbations in the Brain

Theodosia Vallianatou et al. ACS Chem Neurosci. .

Abstract

Detailed metabolic imaging of specific brain regions in early aging may expose pathophysiological mechanisms and indicate effective neuropharmacological targets in the onset of cognitive decline. Comprehensive imaging of brain aging and drug-target effects is restricted using conventional methodology. We simultaneously visualized multiple metabolic alterations induced by normal aging in specific regions of mouse brains by integrating Fourier-transform ion cyclotron resonance mass spectrometry imaging and combined supervised and unsupervised machine learning models. We examined the interplay between aging and the response to tacrine-induced acetylcholinesterase inhibition, a well-characterized therapeutic treatment against dementia. The dipeptide carnosine (β-alanyl-l-histidine) and the vitamin α-tocopherol were significantly elevated by aging in different brain regions. l-Carnitine and acetylcholine metabolism were found to be major pathways affected by aging and tacrine administration in a brain region-specific manner, indicating altered mitochondrial function and neurotransmission. The highly interconnected hippocampus and retrosplenial cortex displayed different age-induced alterations in lipids and acylcarnitines, reflecting diverse region-specific metabolic effects. The subregional differences observed in the hippocampal formation of several lipid metabolites demonstrate the unique potential of the technique compared to standard mass spectrometry approaches. An age-induced increase of endogenous antioxidants, such as α-tocopherol, in the hippocampus was detected, suggesting an augmentation of neuroprotective mechanisms in early aging. Our comprehensive imaging approach visualized heterogeneous age-induced metabolic perturbations in mitochondrial function, neurotransmission, and lipid signaling, not always attenuated by acetylcholinesterase inhibition.

Keywords: Acetylcholine; aging; brain metabolomics; lipids; mass spectrometry imaging; tacrine.


Conflict of interest statement

The authors declare no competing financial interest.

Figures
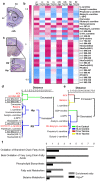
Figure 1
Figure 1
Multivariate analysis of MALDI-MSI data on the effect of age and tacrine administration in multiple brain regions. (a) The brain areas included in the first MVA are illustrated on a Nissl-stained coronal mouse brain tissue section (0.26 mm from bregma). (b) Pearson correlation coefficient (r) between the significantly modified analytes and the investigated age and tacrine presented as a heat map: The red palette indicates positive correlation, whereas the blue palette indicates negative correlation. (c) The brain areas in the second MVA are illustrated on a Nissl-stained coronal mouse brain tissue section (−1.06 mm from bregma). (d) Hierarchical clustering analysis of the age-induced metabolic changes. The green branches correspond to metabolites with higher log intensity values in 12-w animals, whereas the blue branches correspond to molecules with higher log intensity values in 14-m animals. Values (m/z) annotated in black boxes correspond to the following m/z values presented in the heat map: 850.648, 968.559, 970.538, and 982.536 (in order of appearance; mass difference is owing to separate tuning of the MS methods, with the second analysis being optimized for a lower m/z range). (e) Hierarchical clustering analysis of tacrine-induced metabolic changes. Green branches correspond to metabolites showing higher log intensity values in the 12-w control group, blue branches correspond to metabolites showing higher log intensity values in the 14-m control group, red branches correspond to metabolites showing higher log intensity values in the 12-w tacrine group, and yellow branches correspond to metabolites showing higher intensity in the 14-m tacrine group. Metabolites not detected in the previous PCA model are highlighted in red. (f) Enrichment analysis showing five metabolic pathways based on significance rank (i.e., altered and identified metabolites). Abbreviations: cc, corpus callosum; Cx, cortex; mfb, medial forebrain bundle; Str, striatum; α-GPC, α-glycerophosphocholine; CDP-choline, cytidine diphosphate choline; HexCer, hexosylated ceramide; PC, phosphatidylcholine; Hip, hippocampus; RS, retrosplenial cortex; ACh, acetylcholine; 3-OH-C11-l-carnitine, 3-hydroxyl-undecanoyl-l-carnitine; −log10P, negative logarithm of the probability P.
Figure 2
Figure 2
Age-induced alterations of carnosine, homocarnosine, and α-tocopherol in mouse brain tissue sections. (a) MALDI-MSI of carnosine (m/z 494.219, scaled to 100% of maximum intensity) in coronal mouse brain tissue sections (0.26 mm from bregma) at a lateral resolution of 100 μm. (b) MALDI-MSI of carnosine (scaled to 5% of maximum intensity) and homocarnosine (m/z 508.233, scaled to 60% of maximum intensity) in sagittal mouse brain tissue at a lateral resolution of 100 μm. (c) MALDI-MSI of α-tocopherol (m/z 698.492, scaled to 40% of maximum intensity) in coronal mouse brain tissue section of a 12-w control animal (−1.60 mm from bregma) at a lateral resolution of 50 μm. (d) MALDI-MSI of α-tocopherol (m/z 698.492, scaled to 100% of maximum intensity) in coronal mouse brain tissue sections (−1.06 mm from bregma) at a lateral resolution of 80 μm. The data are normalized to RMS of all data points. Abbreviations: CA3, CA hippocampal area 3; CPu, caudate-putamen; CxLI, cerebral cortex layer I; CxLVI, cerebral cortex layer VI; D3 V, dorsal third ventricle; GrDG, granular layer of the dentate gyrus; LH, lateral hypothalamus; LV, lateral ventricle; Py, pyramidal layer; Th, thalamus.
Figure 3
Figure 3
l-Carnitine/acetyl-l-carnitine pathway in coronal mouse brain tissue sections. (a) MALDI-MSI of l-carnitine (m/z 162.112) and acetyl-l-carnitine (m/z 204.123) at a lateral resolution of 100 μm (0.26 mm from bregma). The data are normalized to RMS of all data points (images scaled to 100% of maximum intensity). (b) Image of the ACh/acetyl-l-carnitine ratio at a lateral resolution of 80 μm (−1.60 mm from bregma). (c) Pearson correlation coefficient (r) between the molecular properties and distribution pattern of l-carnitine derivatives presented as a heat map. The red palette indicates positive correlation, whereas the blue palette indicates negative correlation. Abbreviations: AcCoA, acetyl coenzyme A; ACh, acetylcholine; C, control; CoASH, coenzyme A; CAT I, carnitine acetyltransferase I; Hip, hippocampus; log P, octanol/water partition coefficient (lipophilicity index); MW, molecular weight; PSA, polar surface area (hydrogen bonding index); RS, retrosplenial cortex; T, tacrine.
Figure 4
Figure 4
ACh/choline metabolic pathway in sagittal mouse brain tissue sections. MALDI-MS images obtained at a lateral resolution of 100 μm. The data for CDP-choline (m/z 527.069, scaled to 50% of maximum intensity), α-GPC (m/z 258.109, scaled to 100% of maximum intensity), and betaine (m/z 156.042, scaled to 100% of maximum intensity) are normalized to the RMS of all data points, whereas ACh (m/z 146.118, scaled to 60% of maximum intensity) is normalized to its internal standard.
Figure 5
Figure 5
Age-modified lipid species in mouse brain tissue sections. (a) MALDI-MSI of PC(40:1) (m/z 882.631) and HexCer(t41:1) (m/z 836.654) in coronal mouse brain tissue sections (0.26 mm from bregma) at a lateral resolution of 100 μm (scaled to 100% of maximum intensity). (b) MALDI-MSI of HexCer(t41:1) (scaled to 60% of maximum intensity) in coronal mouse brain tissue sections (−1.60 mm from bregma) at a lateral resolution of 80 μm. (c) Nissl-stained mouse brain tissue section of a 14-m old animal (−1.60 mm from bregma). The DG is delineated with a white dashed line. (d) Overlay of a MALDI-MS image of HexCer(t41:1) and a Nissl-stained mouse brain tissue section.
Figure 6
Figure 6
Brain distribution and OCTN-mediated uptake of tacrine and OH-tacrine. (a) MALDI-MSI of tacrine (m/z 199.122, scaled to 100% of maximum intensity) and (b) OH-tacrine (m/z 215.118, scaled to 80% of maximum intensity) in coronal mouse brain tissue sections (−1.06 mm from bregma) of 12-w and 14-m tacrine-administered animals at a lateral resolution of 80 μm. All data are normalized to 9AA, which was used as an internal standard. (c) Inhibition of OCTN1-and OCTN2-mediated uptake of quinidine by verapamil (model inhibitor), tacrine, and 1-OH-tacrine. (d) OCNT1- and OCTN2-mediated uptake of tacrine and 1-OH-tacrine. Error bars show the 95% confidence interval (n = 4). *P < 0.05; ns, not significant.

References

    1. Niccoli T.; Partridge L. (2012) Ageing as a risk factor for disease. Curr. Biol. 22, R741–752. 10.1016/j.cub.2012.07.024. - DOI - PubMed
    1. Mishur R. J.; Rea S. L. (2012) Applications of mass spectrometry to metabolomics and metabonomics: detection of biomarkers of aging and of age-related diseases. Mass Spectrom. Rev. 31, 70–95. 10.1002/mas.20338. - DOI - PubMed
    1. Tomas-Loba A.; Bernardes de Jesus B.; Mato J. M.; Blasco M. A. (2013) A metabolic signature predicts biological age in mice. Aging Cell 12, 93–101. 10.1111/acel.12025. - DOI - PMC - PubMed
    1. Durani L. W.; Hamezah H. S.; Ibrahim N. F.; Yanagisawa D.; Makpol S.; Damanhuri H. A.; Tooyama I. (2017) Age-related changes in the metabolic profiles of rat hippocampus, medial prefrontal cortex and striatum. Biochem. Biophys. Res. Commun. 493, 1356–1363. 10.1016/j.bbrc.2017.09.164. - DOI - PubMed
    1. Wijeyesekera A.; Selman C.; Barton R. H.; Holmes E.; Nicholson J. K.; Withers D. J. (2012) Metabotyping of long-lived mice using 1H NMR spectroscopy. J. Proteome Res. 11, 2224–2235. 10.1021/pr2010154. - DOI - PMC - PubMed

Publication types