. 2021 Jun 15;120(12):2566-2576.
doi: 10.1016/j.bpj.2021.04.027. Epub 2021 May 1.

Chromatin investigation in the nucleus using a phasor approach to structured illumination microscopy

Affiliations

Chromatin investigation in the nucleus using a phasor approach to structured illumination microscopy

Isotta Cainero et al. Biophys J. .

Abstract

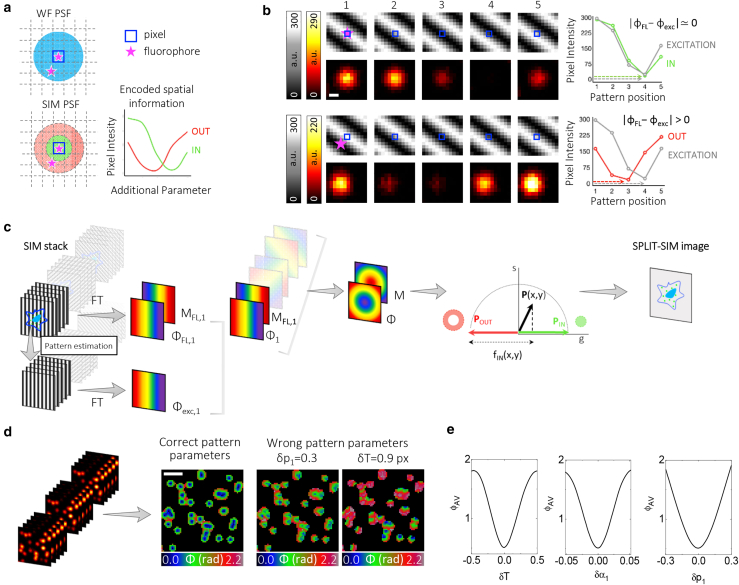
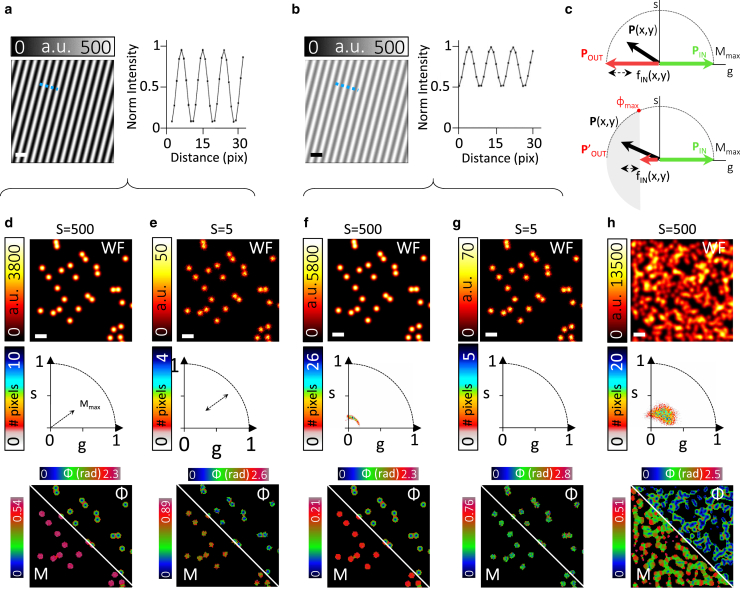
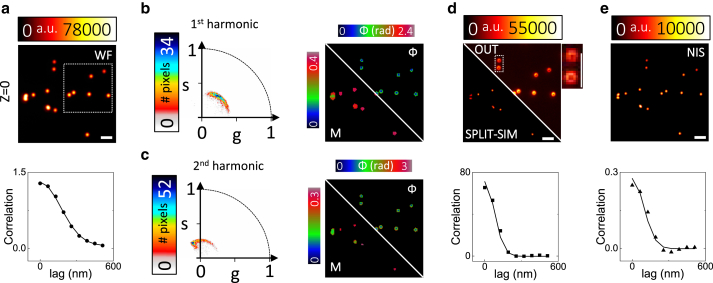
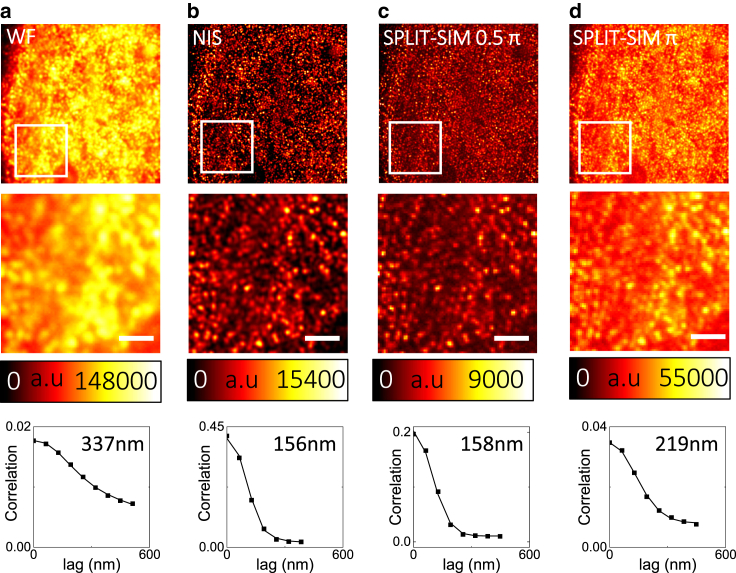
Chromatin in the nucleus is organized in functional sites at variable level of compaction. Structured illumination microscopy (SIM) can be used to generate three-dimensional super-resolution (SR) imaging of chromatin by changing in phase and in orientation a periodic line illumination pattern. The spatial frequency domain is the natural choice to process SIM raw data and to reconstruct an SR image. Using an alternative approach, we demonstrate that the additional spatial information encoded in the knowledge of the position of the illumination pattern can be efficiently decoded using a generalized version of separation of photon by lifetime tuning (SPLIT) that does not require lifetime measurements. In the resulting SPLIT-SIM, the SR image is obtained by isolating a fraction of the intensity corresponding to the center of the diffraction-limited point spread function. This extends the use of the SPLIT approach from stimulated emission depletion microscopy to SIM. The SPLIT-SIM algorithm is based only on phasor analysis and does not require deconvolution. We show that SPLIT-SIM can be used to generate SR images of chromatin organizational motifs with tunable resolution and can be a valuable tool for the imaging of functional sites in the nucleus.


Figures

Figure 1
Figure 1
Description of the SPLIT-SIM method. (a) Schematic comparison between the widefield (WF) diffraction-limited point spread function (PSF) and the SIM PSF, which contains subdiffraction spatial information encoded into an additional channel. (b) Simulated SIM images for a point-like fluorophore (pink star) centered with the central pixel (top) and far from the central pixel (bottom). Shown are the images of the illumination pattern shifting in one direction (grayscale) and the corresponding fluorescence image (red heat scale). The intensity of the central pixel as a function of the position of the pattern is shown in the far right: when the fluorophore is centered with the central pixel, the fluorescence intensity (IN) is similar to the intensity of the illumination (EXCITATION) whereas when the fluorophore is far from the central pixel, the fluorescence intensity (OUT) shows a different behavior in respect to the illumination intensity. Scale bars, 200 nm. (c) Schematic workflow of the SPLIT-SIM algorithm, from the SIM image acquisition stack to the formation of the SPLIT-SIM image: calculation of a modulation and phase image for each orientation of a SIM stack, pattern parameter estimation, calculation of the average phase and modulation images, decomposition in the phasor plot, and reconstruction of the super-resolved image. (d) Simulated SIM image stack and corresponding phase images calculated with the correct pattern parameters, with a wrong value of the offset of the first angle (δp1 = 0.3) and with a wrong value of the period (δT = 0.9 px), respectively. Scale bars, 1 μm. (e) Representations of the average phase value (ϕAV) as a function of the period (T), the first orientation angle (α1), and the offset of the first angle (p1). The setting of “correct” pattern parameters minimizes the average value of the phase (ϕAV). To see this figure in color, go online.
Figure 2
Figure 2
SPLIT-SIM on simulated SIM images of point-like sources. (a) Simulated image of a periodic illumination pattern with maximal contrast (Cp = 1) and corresponding line intensity profile along the dashed line. (b) Simulated image of a periodic illumination pattern with lower contrast (Cp = 0.33) and corresponding line intensity profile along the dashed line. (c) Schematic showing the possible setting of the phasors Pin and Pout. (dg) SPLIT-SIM of simulated SIM images of sparse point-like sources with maximal (d and e) and low (f and g) pattern contrast and different noise levels, as determined by the intensity level S. Shown are, from top to bottom, the widefield image obtained by summing all the images of the stack (WF), the phasor plot, the modulation (M), and the phase (ϕ) image. (h) Same as in (d) but simulating a crowded object. Scale bars, 700 nm. To see this figure in color, go online.
Figure 3
Figure 3
SPLIT-SIM on fluorescent spheres. (a) Widefield image of a sample of 100-nm yellow-green fluorescent spheres and corresponding autocorrelation function (ACF) calculated in the dashed box. (b) Phasor plot of the first harmonic and corresponding phase and modulation images. (c) Phasor plot of the second harmonic and corresponding phase and modulation images. (d) SPLIT-SIM image obtained with ϕmax = 0.5π, image of the residual component corresponding to the periphery of the PSF (OUT), and ACF of the SPLIT-SIM image. For the OUT image, shown is also the zoom of a region containing two beads. (e) NIS Elements reconstruction and corresponding ACF. Scale bars, 1 μm. To see this figure in color, go online.
Figure 4
Figure 4
SPLIT-SIM imaging of the chromatin histone H2B. Widefield image (a), NIS reconstruction (b), and SPLIT-SIM image reconstructed with ϕmax = 0.5π (c) or ϕmax = π (d) of a sample of histone H2B in fixed HeLa cells. Also shown are the ACFs calculated on the white box region along with the corresponding Gaussian fit. Scale bars, 1 μm. To see this figure in color, go online.
Figure 5
Figure 5
Quantitative analysis of the nanoscale distribution of nuclear sites. (ad) ICCS analysis of PCNA (red) and EdU (green) in MCF7 cells imaged by SPLIT-SIM with ϕmax = 0.5π (a and b) or ϕmax = π (c and d). (eh) ICCS analysis of RNApol2 (red) and histone H3K9me2 (green) in MCF7 cells imaged by SPLIT-SIM with ϕmax = 0.5π (e and f) or ϕmax = π (g and h). Shown are the image CCF (black) and ACF of the PCNA (red) and EdU (green) channels. Numbers indicate the measured value of colocalized fraction. Scale bars, 5 μm. To see this figure in color, go online.

References

    1. Betzig E., Patterson G.H., Hess H.F. Imaging intracellular fluorescent proteins at nanometer resolution. Science. 2006;313:1642–1645. - PubMed
    1. Hess S.T., Girirajan T.P., Mason M.D. Ultra-high resolution imaging by fluorescence photoactivation localization microscopy. Biophys. J. 2006;91:4258–4272. - PMC - PubMed
    1. Huang B., Wang W., Zhuang X. Three-dimensional super-resolution imaging by stochastic optical reconstruction microscopy. Science. 2008;319:810–813. - PMC - PubMed
    1. Vicidomini G., Bianchini P., Diaspro A. STED super-resolved microscopy. Nat. Methods. 2018;15:173–182. - PubMed
    1. Hofmann M., Eggeling C., Hell S.W. Breaking the diffraction barrier in fluorescence microscopy at low light intensities by using reversibly photoswitchable proteins. Proc. Natl. Acad. Sci. USA. 2005;102:17565–17569. - PMC - PubMed

Publication types