. 2021 Sep 1;29(9):2821-2840.
doi: 10.1016/j.ymthe.2021.04.035. Epub 2021 May 1.

Cerebral dopamine neurotrophic factor reduces α-synuclein aggregation and propagation and alleviates behavioral alterations in vivo

Affiliations

Cerebral dopamine neurotrophic factor reduces α-synuclein aggregation and propagation and alleviates behavioral alterations in vivo

Katrina Albert et al. Mol Ther. .

Abstract

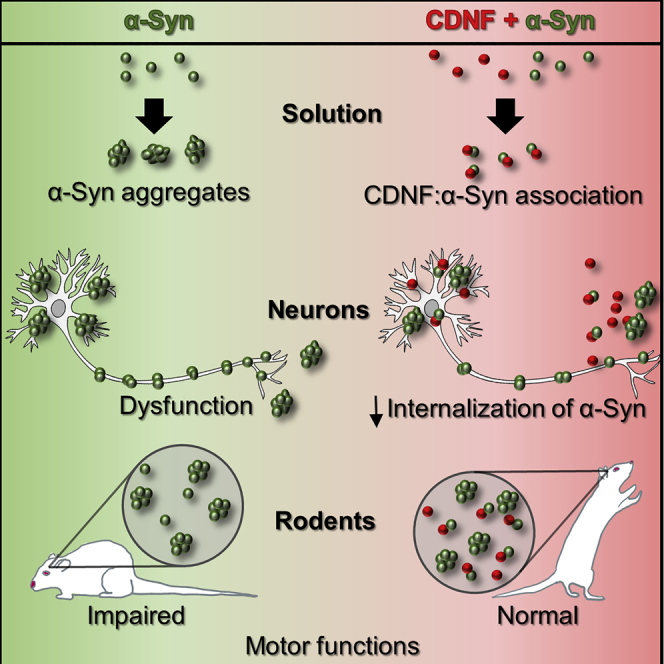
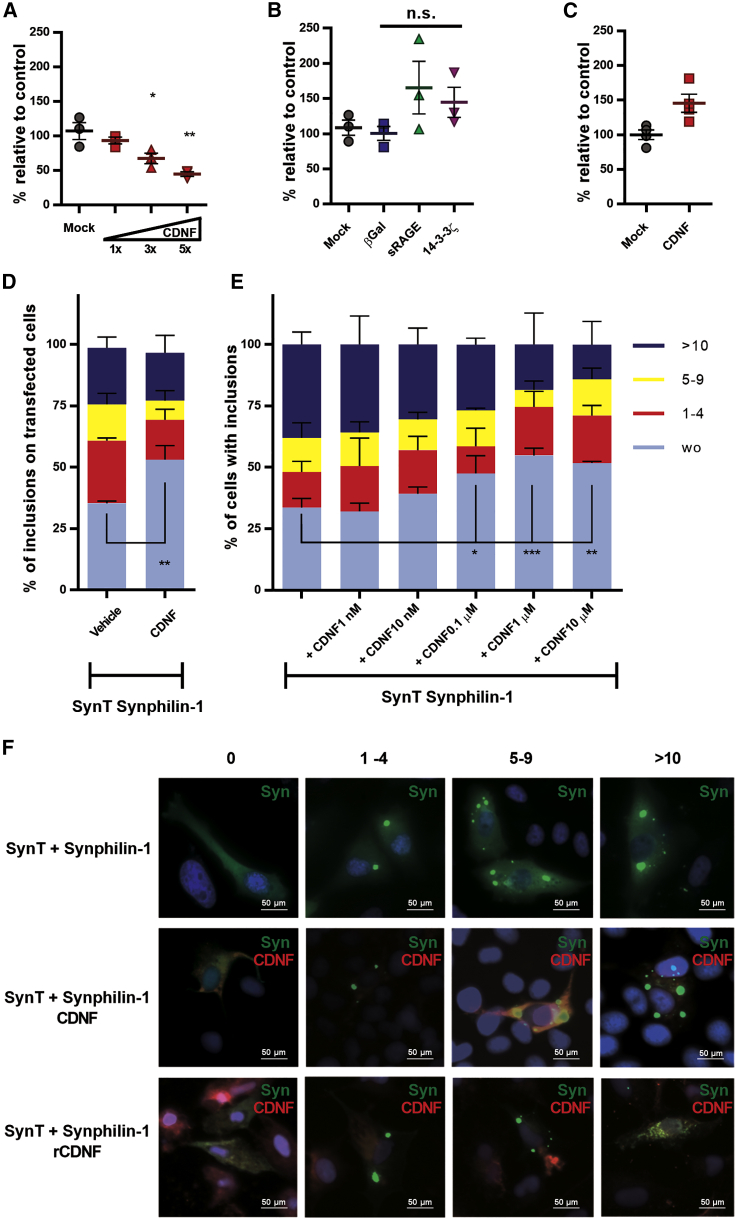
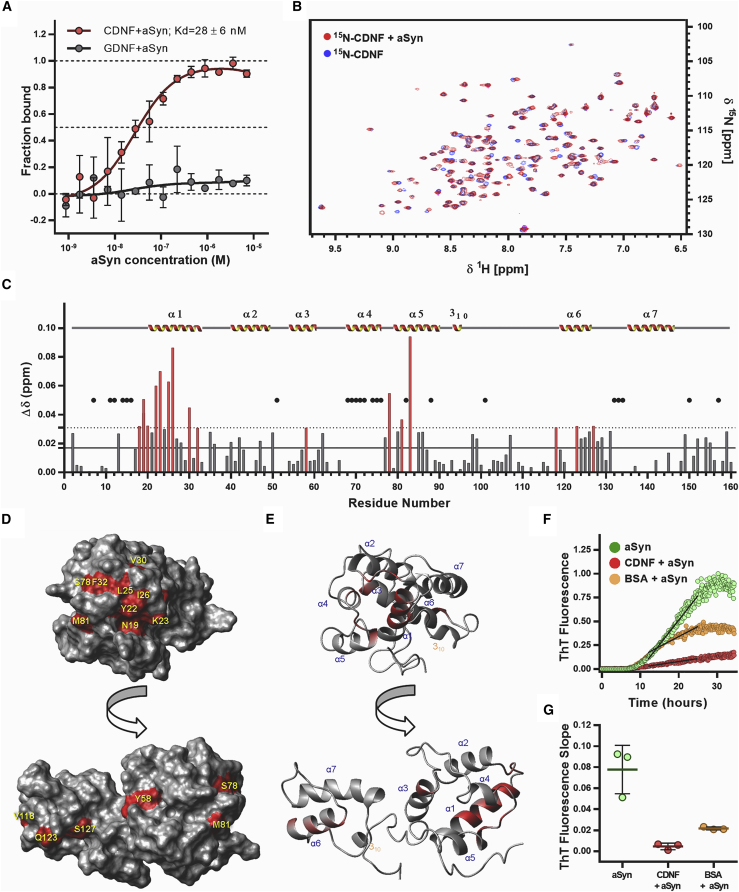
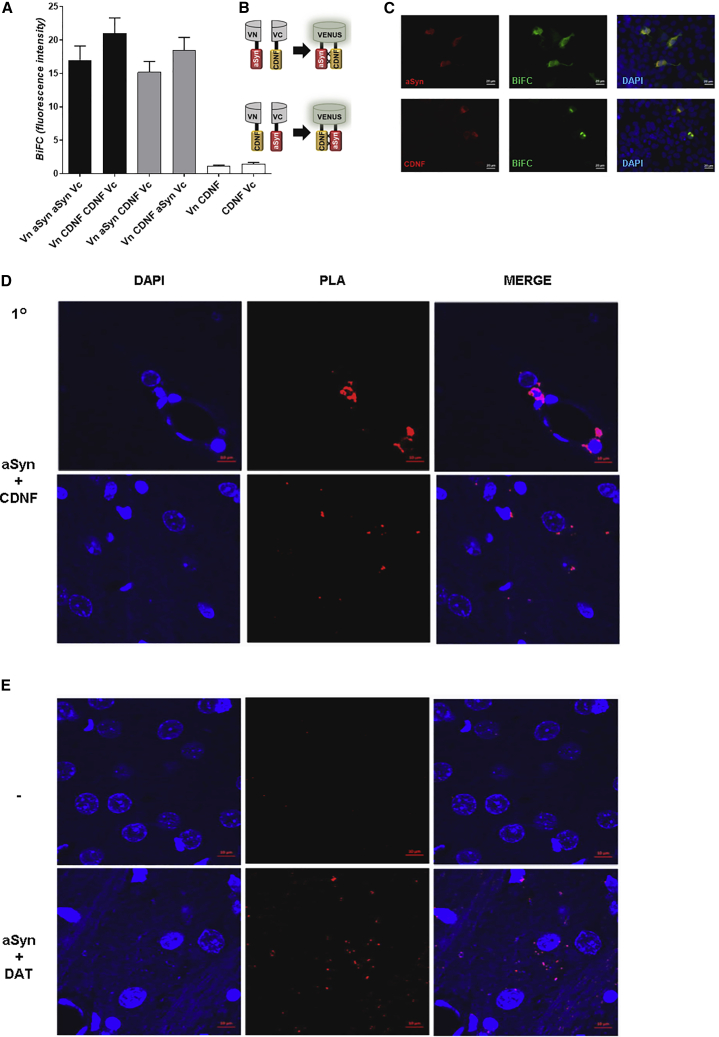
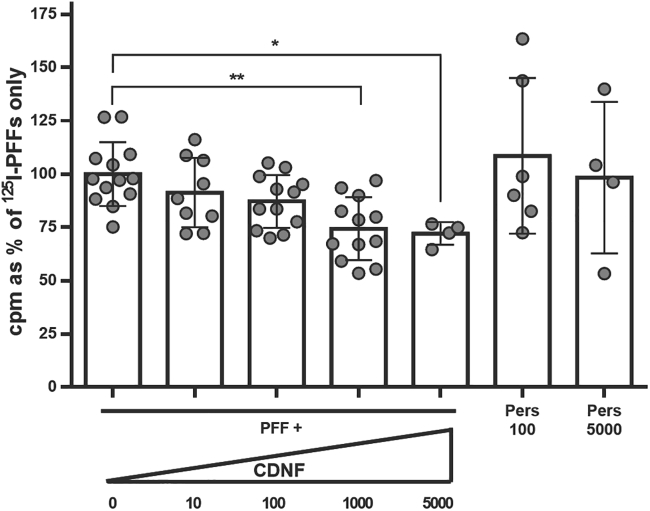
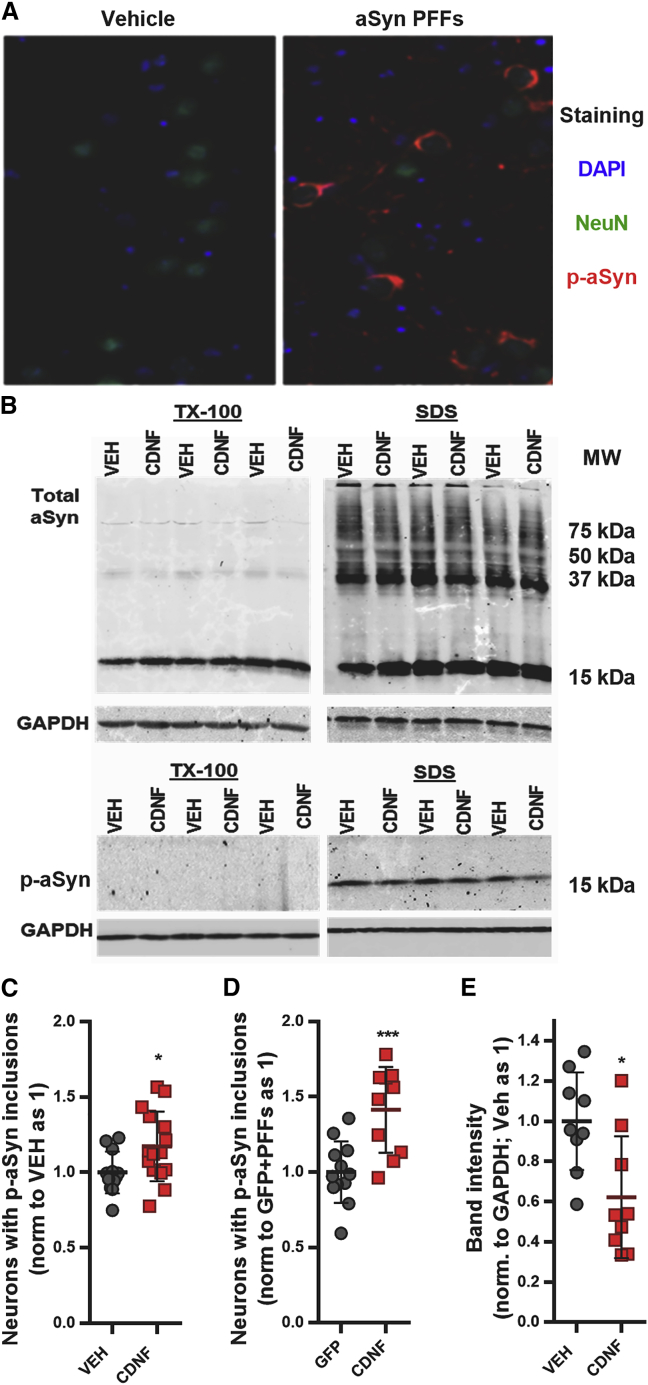
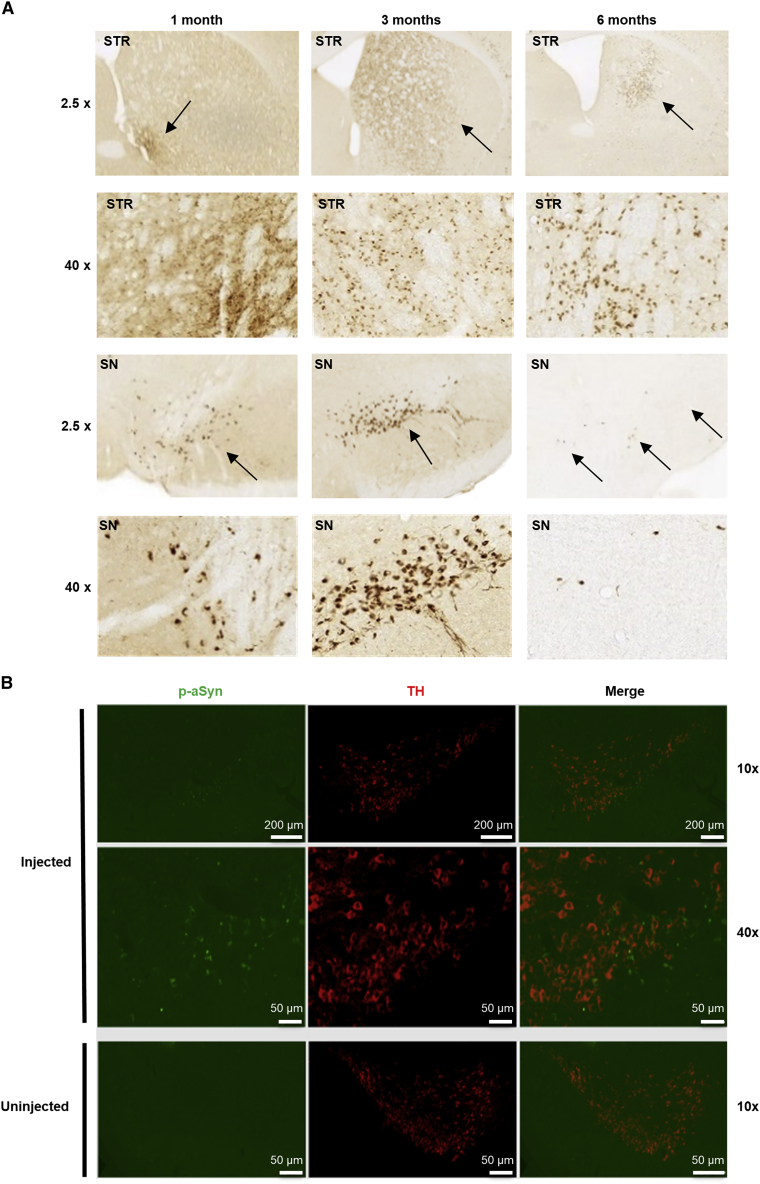
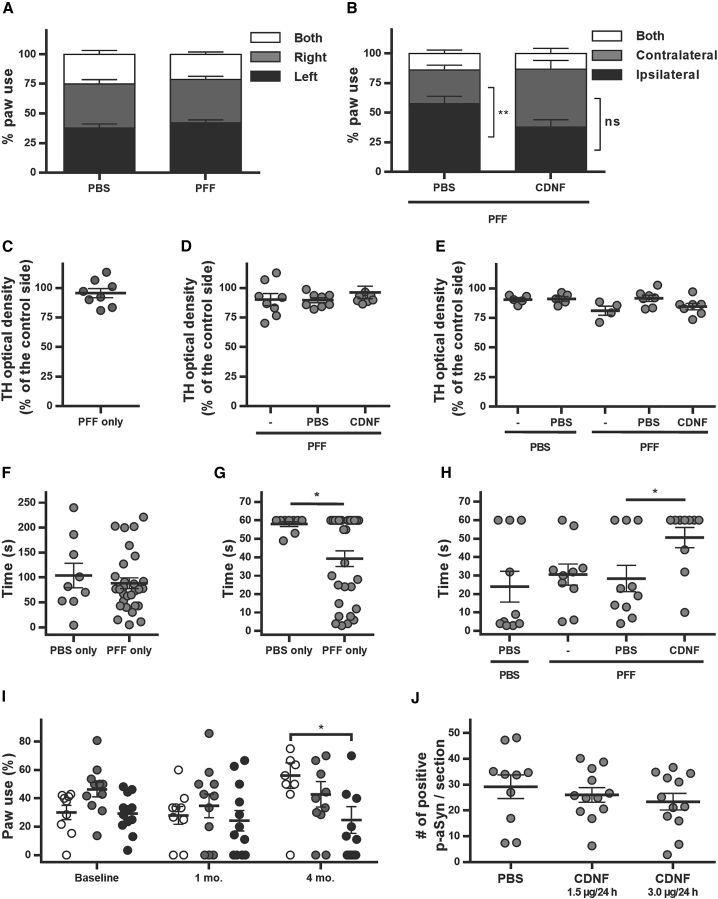
A molecular hallmark in Parkinson's disease (PD) pathogenesis are α-synuclein aggregates. Cerebral dopamine neurotrophic factor (CDNF) is an atypical growth factor that is mostly resident in the endoplasmic reticulum but exerts its effects both intracellularly and extracellularly. One of the beneficial effects of CDNF can be protecting neurons from the toxic effects of α-synuclein. Here, we investigated the effects of CDNF on α-synuclein aggregation in vitro and in vivo. We found that CDNF directly interacts with α-synuclein with a KD = 23 ± 6 nM and reduces its auto-association. Using nuclear magnetic resonance (NMR) spectroscopy, we identified interaction sites on the CDNF protein. Remarkably, CDNF reduces the neuronal internalization of α-synuclein fibrils and induces the formation of insoluble phosphorylated α-synuclein inclusions. Intra-striatal CDNF administration alleviates motor deficits in rodents challenged with α-synuclein fibrils, though it did not reduce the number of phosphorylated α-synuclein inclusions in the substantia nigra. CDNF's beneficial effects on rodent behavior appear not to be related to the number of inclusions formed in the current context, and further study of its effects on the aggregation mechanism in vivo are needed. Nonetheless, the interaction of CDNF with α-synuclein, modifying its aggregation, spreading, and associated behavioral alterations, provides novel insights into the potential of CDNF as a therapeutic strategy in PD and other synucleinopathies.

Keywords: CDNF; MANF; Parkinson’s disease; cerebral dopamine neurotrophic factor; mesencephalic astrocyte-derived neurotrophic factor; pre-formed α-synuclein fibrils; protein aggregation; synucleinopathy; α-synuclein.


Conflict of interest statement

Declaration of interests M.S. is the founder and shareholder of Herantis Pharma Plc. H.J.H. is an employee and a shareholder of Herantis Pharma Plc. A.D. is an employee of Orion Corporation.

Figures

None
Graphical abstract
Figure 1
Figure 1
Effect of CDNF on α-synuclein auto association in cells (A–C) Neuro2A cells were transiently transfected with a pair of reporter plasmids expressing human wild-type α-synuclein fused to one of the split Gaussia luciferase (GLuc) fragments. Upon oligomerization, the interaction allows reconstitution of luciferase activity from the complementary GLuc fragments. (A) Co-expression of CDNF with its original signal sequence (mostly ER luminal protein) dose-dependently reduced α-synuclein oligomerization. Doses of CDNF expression plasmid 1× = 12.5 ng, 3× = 37.5 ng, 5× = 62.5 ng. (B) Co-expression of β-galactosidase (mainly lysosomal protein), soluble receptor for advanced glycation end products (sRAGE; a secreted protein), and 14-3-3ζ (a cytosolic protein) did not significantly alter α-synuclein oligomerization. (C) Cells co-transfected with full-length (GLuc) enzyme together with CDNF did not show decreased luciferase activity as compared to cells co-transfected with a mock plasmid. (D–F) Cells co-transfected with SynT/Synphilin-1 and CDNF with its original signal sequence, grown for 48 h (D and lines 1 and 2 in F) or pre-treated with recombinant human CDNF (E and line 3 in F) before the transient transfections with SynT/Synphilin-1. Cells were processed for immunocytochemistry with antibodies against human α-synuclein (green) or CDNF (red) and analyzed by fluorescence microscopy for the presence of inclusions. Cells were categorized according to the number of inclusions per cell: cells without inclusions (wo), between 1 to 4 (1–4), 5 to 9 (5–9), or more than 10 inclusions (>10). The scale bars represent 50 μm. The ordinary one-way ANOVA test was performed to analyze the differences between the various groups. ∗p ≤ 0.05, ∗∗p ≤ 0.01, ∗∗∗p ≤ 0.001. Error bars represent SEM.
Figure 2
Figure 2
CDNF and α-synuclein (aSyn) interaction in vitro, sites of interaction and interaction kinetics (A) Human recombinant CDNF (n = 3) and GDNF (n = 2) proteins were used as fluorescently labeled targets at final concentrations of 20 nM in microscale thermophoresis experiments. Recombinant purified α-synuclein was used as a ligand in an indicated concentration range. Symbols and error bars represent mean values ± standard deviation. The experimental data were normalized against CDNF data, which fit to a saturation one-site binding equation at R2 = 0.92. KD value ± standard error estimates calculated from the fit are shown in the figure legend. (B) 2D [1H-15N]-HSQC spectra of the15N-labeled human recombinant CDNF in the absence (blue) and in the presence (red) of monomeric α-synuclein. Spectra were collected at 25°C with 0.2 mM of each protein. (C) Bar plot of the combined chemical shift difference (Δδ) of 1H and 15N for each amino acid of CDNF after addition of monomeric α-synuclein. The mean (black line) and standard deviation (dashed line) of all Δδ (ppm) are shown. Chemical shift differences above the standard deviation are identified by red bars. The black dots represent peaks that were not found in the 2D [1H-15N]-HSQC spectra. Secondary structure elements are identified in the graph. (D) Surface plot of CDNF 3D structure highlighting residues with combined chemical shift differences (Δδ) above 0.03 ppm after addition of α-synuclein. This indicates influence of α-synuclein on these residues. (E) Cartoon of the CDNF polypeptide backbone fold at the same orientations of the surface plots, highlighting in red the locations of the residues identified in (D). (F) ThT fluorescence experiment: 70 μM of α-synuclein in the absence (green) and in the presence of 70 μM human recombinant CDNF (red) or 70 μM BSA (yellow) were incubated at 37°C under agitation in a 96-well plate with 1/8-in diameter polyballs, n = 3. All wells have 10 μM ThT. A linear regression was calculated for each curve, to represent the slope of the growth phase of ThT fluorescence (black lines). (G) The ThT fluorescence slopes of the growth phase for three experiments are plotted. Floating bars represent the limits and the mean for each group. One-way ANOVA was applied for assessing the differences between the various groups (p = 0.0013).
Figure 3
Figure 3
CDNF interacts with α-synuclein (aSyn) in cells and in rat brain tissue (A–C) The interaction between CDNF and α-synuclein was probed in living cells using the bimolecular fluorescence complementation (BiFC) assay. Living HEK cells expressing different α-synuclein and CDNF BiFC constructs (indicated on the left) were imaged, and the Venus fluorescence confirmed the interaction in living cells. Cells were then fixed and processed for immunocytochemistry and stained with antibodies against α-synuclein and CDNF. BiFC interactions are presented in green, counterstaining (aSyn and CDNF) is shown in red, and DAPI staining is shown in blue. Images of controls used for the BiFC studies are shown in Figure S4. Scale bar represents 20 μm. (D and E) Proximity ligation assay (PLA) was performed to verify the CDNF and α-synuclein interaction in adult 3-month-old male Wistar rats’ brains using α-synuclein and CDNF primary antibodies (aSyn + CDNF). CDNF was injected to the right striatum, and animals (n = 4) were perfused 2 h later. Representative images were taken at 63× from the striatum.Scale bar represents 30 μm. (D) The PLA signal indicating an interaction is shown in red, and DAPI staining is in blue. (E) Sections were subjected to Duolink PLA with either no primary antibodies as a negative control (−), or α-synuclein and dopamine transporter (DAT) primary antibodies for a positive control (aSyn + DAT). Error bars represent SEM.
Figure 4
Figure 4
CDNF reduces internalization of α-synuclein preformed fibrils (PFFs) in a dose-dependent manner 125I-labeled α-synuclein PFFs were added to mouse hippocampal cultures (E16, DIV 7) together with CDNF at different concentrations (ng/mL) or persephin (ng/mL) as a negative control. The PFFs were allowed to be internalized into neurons for 60 min at 37°C, after which the cultures were washed twice with PBS and finally with acid wash that removes the unspecifically bound extracellular PFFs. After this, the cells were lysed with 1 N NaOH, and the radioactive signal from the internalized PFFs was counted using gamma counter. Kruskal-Wallis test = 18.79, number of groups = 7, p = 0.0045. Error bars represent SEM.
Figure 5
Figure 5
CDNF increases the number of neurons carrying pSer129-α-synuclein inclusions and decreases the amount of insoluble pSer129-α-synuclein in primary neuronal culture Timelines of experiments are shown in Figure S5. (A) Representative scanned image of hippocampal culture in 96-well plate seeded with α-synuclein PFFs at days in vitro (DIV 7) and fixed 7 days post-seeding (DIV 14) for immunostaining with anti-NeuN and anti-pSer129 α-synuclein antibodies. (B) Cortical cultures were seeded with PFFs at DIV 7 and treated at DIV 10 with CDNF (125 ng/mL) or PBS as vehicle (VEH), and at DIV 12, the proteins were isolated sequentially with Triton X-100 buffer followed by SDS buffer, separated by PAGE-SDS, and visualized by immunoblotting. (C) The effect of CDNF (1 μg/mL) pretreatment on the number of neurons carrying pSer129-α-synuclein inclusions after PFF seeding (unpaired t test, t = 2.276 df = 25, p = 0.032). (D) The effect of lentiviral-vector-mediated overexpression of CDNF (GFP overexpression as control) on the PFF-seeded neuronal inclusion pathology (unpaired t test, t = 4.239 df = 21, p = 0.0004). (E) The levels of p-aSyn in VEH and CDNF treated neurons quantified from the SDS immunoblots (unpaired t test, t = 2.920 df = 16, p = 0.01). Error bars represent SEM.
Figure 6
Figure 6
PFF-induced α-synuclein phosphorylation and propagation of α-synuclein aggregation (A) Wild-type mice (3 months old at time of injection) were injected with PFFs to the striatum (STR) and stained for α-synuclein phosphorylated at S129 (p-aSyn) in the STR and substantia nigra (SN) areas at 1, 3, and 6 months after PFF injection. Images at 2.5× magnification and close-ups at 40× magnification are shown. Black arrows at 2.5× indicate approximate areas of p-aSyn-positive staining (dark brown); 40× images show widespread p-aSyn-positive staining. (B) Double immunofluorescence staining of substantia nigra area for tyrosine hydroxylase (TH, red) and p-aSyn (green) of injected (left panels) and uninjected hemispheres (right panels). Scale bars represent 200 μm (top row) and 50 μm (bottom rows). Additional controls are included in Figure S9.
Figure 7
Figure 7
Behavior and outcome after CDNF treatment in PFF-injected mice and rats (A–E) Mouse behavior and TH optical density after injections to 3-month-old mice. (A) Cylinder test at 1 month after PFF injection, before CDNF treatment, n = 8/group. (B) Cylinder test at 3 months after PFF/PBS injection, 2 months after CDNF/PBS. The graph represents ipsilateral, contralateral, as well as both paw touches on the cylinder wall. PFF + PBS/PFF + CDNF indicates that PFFs were given at day 0 and PBS/CDNF was given 1 month later, n = 8/group. p = 0.0051 (C) TH optical density in the striatum as a percentage of the control side at 1 month after PFF injection, n = 8. (D) TH optical density in the striatum as a percentage of the control side 3 months after PFFs. PFF only indicates PFFs given at day 0, and PFF + PBS/CDNF PFFs given at day 0 and PBS/CDNF 1 month later, n = 8/group. (E) TH optical density in the striatum as a percentage of the control side. PBS/PFF only indicates PBS or PFFs given at day 0 and no other injections, PBS + PBS indicates PBS given at day 0 and again 1 month later, PFF + PBS/CDNF indicates fibrils at day 0 and PBS/CDNF 1 month later, n = 4–7/group. (F–H) Mouse behavior after injections to 1-year-old mice. (F) Rotarod 1 month after PBS (control, n = 10) or PFF injections (n = 30). (G) Coat hanger time 1 month after injection, PBS (n = 9); PFF (n = 30). p = 0.022. (H) Coat hanger time 3 months after PBS or PFFs injection, 2 months after PBS or CDNF. PBS/PFF only indicates PBS or PFFs given at day 0 and no other injections, PBS + PBS indicates PBS given at day 0 and again 1 month later, PFF + PBS/CDNF indicates fibrils at day 0 and PBS/CDNF 1 month later, n = 10/group. p = 0.0410. (I and J) Behavior and histopathological outcome after injections to 1-year-old rats. (I) Contralateral paw use (percent of total paw use). Baseline indicates the data obtained before PFFs were injected, 1 month is 1 month after fibrils but before installation of minipumps, and 4 months is 4 months after fibrils and 3 months after treatment. Minipumps administer PBS (white symbols), CDNF at 1.5 μg/day (gray symbols), or 3.0 μg/day (black symbols) to the striatum for 30 days, n = 9–12/group. p = 0.0114. (J) Number of inclusions of α-synuclein phosphorylated at S129 (p-aSyn) in the substantia nigra for each treatment 4 months after fibril injections, n = 10–12/group. Error bars represent SEM.

Comment in

References

    1. Fearnley J.M., Lees A.J. Ageing and Parkinson’s disease: substantia nigra regional selectivity. Brain. 1991;114:2283–2301. - PubMed
    1. Dauer W., Przedborski S. Parkinson’s disease: mechanisms and models. Neuron. 2003;39:889–909. - PubMed
    1. Gibb W.R.G., Lees A.J. The significance of the Lewy body in the diagnosis of idiopathic Parkinson’s disease. Neuropathol. Appl. Neurobiol. 1989;15:27–44. - PubMed
    1. Spillantini M.G., Schmidt M.L., Lee V.M.-Y., Trojanowski J.Q., Jakes R., Goedert M. α-synuclein in Lewy bodies. Nature. 1997;388:839–840. - PubMed
    1. Volpicelli-Daley L.A., Luk K.C., Lee V.M.-Y. Addition of exogenous α-synuclein preformed fibrils to primary neuronal cultures to seed recruitment of endogenous α-synuclein to Lewy body and Lewy neurite-like aggregates. Nat. Protoc. 2014;9:2135–2146. - PMC - PubMed

Publication types

MeSH terms