Trial sequential analysis: novel approach for meta-analysis
- PMID: 33940767
- PMCID: PMC8107247
- DOI: 10.17085/apm.21038
Trial sequential analysis: novel approach for meta-analysis
Abstract
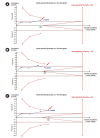
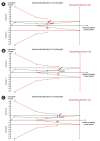
Systematic reviews and meta-analyses rank the highest in the evidence hierarchy. However, they still have the risk of spurious results because they include too few studies and participants. The use of trial sequential analysis (TSA) has increased recently, providing more information on the precision and uncertainty of meta-analysis results. This makes it a powerful tool for clinicians to assess the conclusiveness of meta-analysis. TSA provides monitoring boundaries or futility boundaries, helping clinicians prevent unnecessary trials. The use and interpretation of TSA should be based on an understanding of the principles and assumptions behind TSA, which may provide more accurate, precise, and unbiased information to clinicians, patients, and policymakers. In this article, the history, background, principles, and assumptions behind TSA are described, which would lead to its better understanding, implementation, and interpretation.
Keywords: Interim analysis; Meta-analysis; Statistics; Trial sequential analysis.
Conflict of interest statement
No potential conflict of interest relevant to this article was reported.
Figures


References
-
- Wald A. Contributions to the theory of statistical estimation and testing hypotheses. Ann Math Stat. 1939;10:299–326.
-
- Armitage P, McPherson CK, Rowe BC. Repeated significance tests on accumulating data. J R Stat Soc Ser A. 1969;132:235–44.
-
- Higgins JPT, Green S. Cochrane handbook for systematic reviews of interventions version 5.1.0. Cochrane [serial on the Internet]. 2011 Mar [2021 Mar 15]. Available from www.handbook.cochrane.org.
-
- Kang H. Statistical considerations in meta-analysis. Hanyang Med Rev. 2015;35:23–32.
Publication types
LinkOut - more resources
Full Text Sources
Other Literature Sources
Research Materials

