. 2021 Apr 28;154(16):165102.
doi: 10.1063/5.0040649.

Informing NMR experiments with molecular dynamics simulations to characterize the dominant activated state of the KcsA ion channel

Affiliations

Informing NMR experiments with molecular dynamics simulations to characterize the dominant activated state of the KcsA ion channel

Sergio Pérez-Conesa et al. J Chem Phys. .

Abstract

As the first potassium channel with an x-ray structure determined, and given its homology to eukaryotic channels, the pH-gated prokaryotic channel KcsA has been extensively studied. Nevertheless, questions related, in particular, to the allosteric coupling between its gates remain open. The many currently available x-ray crystallography structures appear to correspond to various stages of activation and inactivation, offering insights into the molecular basis of these mechanisms. Since these studies have required mutations, complexation with antibodies, and substitution of detergents in place of lipids, examining the channel under more native conditions is desirable. Solid-state nuclear magnetic resonance (SSNMR) can be used to study the wild-type protein under activating conditions (low pH), at room temperature, and in bacteriomimetic liposomes. In this work, we sought to structurally assign the activated state present in SSNMR experiments. We used a combination of molecular dynamics (MD) simulations, chemical shift prediction algorithms, and Bayesian inference techniques to determine which of the most plausible x-ray structures resolved to date best represents the activated state captured in SSNMR. We first identified specific nuclei with simulated NMR chemical shifts that differed significantly when comparing partially open vs fully open ensembles from MD simulations. The simulated NMR chemical shifts for those specific nuclei were then compared to experimental ones, revealing that the simulation of the partially open state was in good agreement with the SSNMR data. Nuclei that discriminate effectively between partially and fully open states belong to residues spread over the sequence and provide a molecular level description of the conformational change.


Figures

FIG. 1.
FIG. 1.
Summary scheme of the various computational steps carried out in this work. (a) Illustration of the gating cycle of KcsA and the corresponding x-ray crystallography structures with the nomenclature used for the different states. (b) Bayes law (top equation) and its terms: the posterior distribution [p(μ, σ, α| d)] is proportional to the product of the likelihood [p(d| μ, σ, α)] and the priors [p(μ, σ, α)], where μ, σ, and α are the position, scale, and skewness parameters of a skew-normal distribution, respectively, and d is the chemical shift data for a particular nucleus of the protein. The posterior probability of the parameters of a skew-normal distribution representative of the CS calculated from the MD simulation ensemble is proportional to the product of the likelihood of the data (predicted chemical shifts) multiplied by the prior distribution of the parameters (chosen here as uninformative). The definition of the mean of this skew-normal distribution is reported as the CSsimX with its 94% credible interval. (c) Criteria imposed to consider a given residue’s CS as statistically significant. This is illustrated using two idealized CS-likelihoods obtained from the posteriors inferred for the two possible activated states, showing how their overlap and location affects statistical significance. This was done by assessing the difference in means between the two states (CSsimFOCSsimPO) and the effect size of this difference CSsimFOCSsimPOstdpool, where stdpool=var(CSsimFO)var(CSsimPO)2 and var is the variance function. (d) Assignment of nuclei indicating compatibility of the activated state NMR sample with the PO or FO MD simulation ensembles. The method we use involves calculating the CS difference between the Closed (C) and the Partially Open/Fully Open (PO/FO) states (labeled X) measured using SSNMR (ΔCSexp) and predicted from the MD simulations ensemble (ΔCSsimX) for the nuclei determined in (c). If the difference between the ΔCS measured experimentally and using the simulation ensemble (ΔΔCSX) is smaller for the PO than the FO state, this nucleus supports the conclusions that the experimentally observed activated state is the PO state seen in crystal structures. The reverse is true if the difference is smaller for the FO state.
FIG. 2.
FIG. 2.
Representative experimental NMR spectra of KcsA in the activated state (3:1 DOPE:DOPG, 50 mM KCl, pH 4.0). (a) NCA region of the 2D 15N–13C NcaCX spectrum with assigned peaks shown. All peaks in the NcaCX spectrum are Cαi–Ni unless noted otherwise. (b) NCO region of the 2D 15N–13C NcoCX spectrum with assigned peaks shown. All peaks in the NcoCX spectrum are Ci−1–Ni unless noted otherwise. (c) Cα–Cβ region of 2D 13C–13C DARR spectrum with assigned peaks labeled. All peaks in the DARR spectrum are Cαi-Cβi unless noted otherwise. Peaks used to distinguish between fully open vs partially open (identified by statistical inference analysis of the CS predictions of MD snapshots) are labeled in red, and those identified (by the same methods) as spectators are labeled in gray.
FIG. 3.
FIG. 3.
Statistical filtering of simulated CS. Circles represent the center of the 94% credible interval of the variable distribution, and horizontal bars represent the full range of the corresponding credible interval (which are not visible in cases where the interval is smaller than or comparable to the symbol size). The vertical axis represents the residues that are part of the experimental dataset in both pH conditions. We show here CS differences for the Cα nuclei using the SPARTA+ chemical shift prediction method. Left: credible interval of the CSsimX difference in means between the Fully Open (FO) and Partially Open (PO) states. If a credible interval center is outside the experimental tolerance range (green shade), the difference is considered significant. Right: credible interval of the effect size (difference in means scaled by the pooled standard deviation) between the FO and PO states. If the credible interval center is greater than 0.5 in absolute value (green shade), the effect size is considered medium-large. A residue must have a significant difference in means and a large effect size to be considered as having discrimination power. The same procedure was carried out for the rest of the nuclei and chemical shift prediction methods (Figs. S23 and S24).
FIG. 4.
FIG. 4.
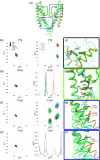
(a) Centers of 94% credible intervals of the difference in relative chemical shifts between experiment and simulation in absolute value. The limits of the credible interval are shown as error bars. Both experiment and simulation use as reference the closed state chemical shifts: ΔCSsimX = CSsimXCSsimC and ΔCSexp = CSexppH4CSexppH7.5, where X represents the FO or PO sate. The residues found to be capable of discriminating between PO and FO using our statistical criteria are represented on the x axis for the different nuclei and chemical shift prediction methods. The higher the agreement between MD simulations and the NMR experiments, the closer the value is to zero. The PO state (blue) has, in general, a better agreement with experiment than the FO state (orange). The green shade depicts the typical experimental uncertainty. If two methods produce statistically identical CS or the signal is missing in the spectrum, the bar is not represented. (b) Side view of the molecular structure of the PO state. Only two subunits are shown. Residues identified using one chemical shift prediction method are shown with a thin “licorice representation.” Residues identified using two chemical shift prediction methods are shown with a thick “licorice representation.” (c) Molecular structure of the PO state viewed from the intracellular side. (d) and (e) show the same representations as (b) and (c) but for the FO state. (f) KcsA sequence, truncated to the region of the protein used in the MD simulations. Blue highlights represent residues whose experimental chemical shift agrees with the simulated PO state, orange highlights represent those in agreement with the FO state, and gray highlights represent inconclusive residues.
FIG. 5.
FIG. 5.
Flow chart demonstrating the combinations of the ΔCSsimX and ΔCSexp that yield various classifications of the state markers identified in this study. A threshold of tolerance of 0.2 ppm for 13C and 0.5 ppm for 15N was used to determine if the CS change was significant. FO = fully open, PO = partially open, C = closed, ΔCSsimX = CSsimXCSsimClosed, and ΔCSexp = CSexppH4, actCSexppH7.5, deact.
FIG. 6.
FIG. 6.
Structural comparison between C, PO, and FO states (a) Side view of 2 opposite subunits in the C (green ribbon), PO (blue), and FO states (orange). The selectivity filter region is highlighted by a gray box, the hinge region by a green box, and the cavity facing helices by a purple box. (b) Dihedral (Ramachandran and χ1-χ2 plots) angle plots showing the MD simulation distributions [surface contours, coloring is the same as in panels (a) and (c)] and corresponding molecular models showing details of the environment around Y78 in the three states. Snapshots were aligned on the selectivity filter residue backbone (75–80) of the subunit Y78 belongs to. [(d) and (e)] Same as (c) for S102. [(f)–(i)] Same as (c) for F103 and T107. The molecular views in the purple boxes [(g) and (i)] show the rearrangement of the rotameric state of T107 from the crystal structure to the most prevalent rotameric state observed in MD simulations, in the FO state.

Similar articles

Cited by

References

    1. Cournia Z. and Chatzigoulas A., “Allostery in membrane proteins,” Curr. Opin. Struct. Biol. 62, 197–204 (2020).10.1016/j.sbi.2020.03.006 - DOI - PubMed
    1. Xu Y., Bhate M. P., and McDermott A. E., “Transmembrane allosteric energetics characterization for strong coupling between proton and potassium ion binding in the KcsA channel,” Proc. Natl. Acad. Sci. U. S. A. 114, 8788–8793 (2017).10.1073/pnas.1701330114 - DOI - PMC - PubMed
    1. Li J., Ostmeyer J., Cuello L. G., Perozo E., and Roux B., “Rapid constriction of the selectivity filter underlies C-type inactivation in the KcsA potassium channel,” J. Gen. Physiol. 150, 1408–1420 (2018).10.1085/jgp.201812082 - DOI - PMC - PubMed
    1. Cuello L. G., Cortes D. M., and Perozo E., “The gating cycle of a K+ channel at atomic resolution,” Elife 6, e28032 (2017).10.7554/elife.28032 - DOI - PMC - PubMed
    1. Xu Y., Zhang D., Rogawski R., Nimigean C. M., and McDermott A. E., “Identifying coupled clusters of allostery participants through chemical shift perturbations,” Proc. Natl. Acad. Sci. U. S. A. 116, 2078–2085 (2019).10.1073/pnas.1811168116 - DOI - PMC - PubMed