. 2021 May 3;16(1):83.
doi: 10.1186/s13014-021-01807-4.

An ionising radiation-induced specific transcriptional signature of inflammation-associated genes in whole blood from radiotherapy patients: a pilot study

Affiliations

An ionising radiation-induced specific transcriptional signature of inflammation-associated genes in whole blood from radiotherapy patients: a pilot study

Lourdes Cruz-Garcia et al. Radiat Oncol. .

Abstract

Background: This communication reports the identification of a new panel of transcriptional changes in inflammation-associated genes observed in response to ionising radiation received by radiotherapy patients.

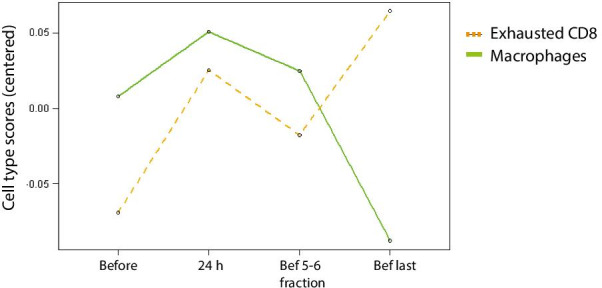
Methods: Peripheral blood samples were taken with ethical approval and informed consent from a total of 20 patients undergoing external beam radiotherapy for breast, lung, gastrointestinal or genitourinary tumours. Nanostring nCounter analysis of transcriptional changes was carried out in samples prior and 24 h post-delivery of the 1st radiotherapy fraction, just prior to the 5th or 6th fraction, and just before the last fraction.

Results: Statistical analysis with BRB-ArrayTools, GLM MANOVA and nSolver, revealed a radiation responsive panel of genes which varied by patient group (type of cancer) and with time since exposure (as an analogue for dose received), which may be useful as a biomarker of radiation response.

Conclusion: Further validation in a wider group of patients is ongoing, together with work towards a full understanding of patient specific responses in support of personalised approaches to radiation medicine.

Keywords: Blood; Cancer; Gene expression; Inflammation; Ionising radiation; NCounter; RT-qPCR; Radiotherapy; Transcription.


Conflict of interest statement

The authors declare that they have no competing interests.

Figures

Fig. 1
Fig. 1
Volcano plots displaying − log10 of the p-value and log2 of the FC of the differential expression analysis between the time points “before the start of the treatment” and a 24 h after first fraction, b before 5th–6th faction, c before last fraction. Horizontal lines indicate various adjusted p-value thresholds when there are significant differences. The 40 most statistically significant genes are labelled in the plot (blue dots) (c)
Fig. 2
Fig. 2
GSA: Gene set analysis with global significance scores and directed global significance scores. a Global significance score plot: orange denotes gene sets whose genes exhibit extensive differential expression with the covariate, blue denotes gene sets with less differential expression. b Directed global significance score plot: red denotes gene sets whose genes exhibit extensive over-expression with the covariate, blue denotes gene sets with extensive under-expression
Fig. 3
Fig. 3
Pathway changes in the different time points a Heatmap of pathways scores including the 4 time points and the 6 cancer types: orange indicates high scores; blue indicates low scores. Scores are displayed on the same scale via a Z-transformation. b Individual pathway scores for each time point c Heatmap of pathways scores comparing the time point “before” and “before last fraction” together with the 6 cancer types
Fig. 4
Fig. 4
Immune cell profiling analysis indicating cell type abundance measurements versus time points. Raw cell type measurements are calculated as the log2 expression of each cell type’s marker genes
Fig. 5
Fig. 5
mRNA expression levels of IL7 and CD40LG in blood from radiotherapy patients analysed by nCounter analysis (a, c) and RT-qPCR (b, d). Blood samples from 20 patients, comprising those with endometrial, breast, lung, prostate, oesophageal and colon cancer, were analysed. Blood was collected at four time points: before the start of the treatment, at 24 h after the first fraction, before 5th–6th fraction and before the last fraction. Individual data points are shown for all patients, together with the mean ± SD (each patient is represented with a different symbol). Each cancer group was color coded. Statistical analyses were performed in log-transformed data. *Significantly different from the control (before treatment) (paired t test, P ≤ 0.05). RU, relative units

References

    1. Rothkamm K, Beinke C, Romm H, Badie C, Balagurunathan Y, Barnard S. Comparison of established and emerging biodosimetry assays. Radiat Res. 2013;180. - PMC - PubMed
    1. Abend M, Badie C, Quintens R, Kriehuber R, Manning G, Macaeva E, et al. Examining radiation-induced in vivo and in vitro gene expression changes of the peripheral blood in different laboratories for biodosimetry purposes: first RENEB gene expression study. Radiat Res. 2016;185(2):109–123. doi: 10.1667/RR14221.1. - DOI - PubMed
    1. Ainsbury E, Badie C, Barnard S, Manning G, Moquet J, Abend M, et al. Integration of new biological and physical retrospective dosimetry methods into EU emergency response plans—joint RENEB and EURADOS inter-laboratory comparisons. Int J Radiat Biol. 2017;93(1):99–109. doi: 10.1080/09553002.2016.1206233. - DOI - PubMed
    1. Tichy A, Kabacik S, O’Brien G, Pejchal J, Sinkorova Z, Kmochova A, et al. The first in vivo multiparametric comparison of different radiation exposure biomarkers in human blood. PLoS ONE. 2018;13(2):e0193412. doi: 10.1371/journal.pone.0193412. - DOI - PMC - PubMed
    1. Badie C, Kabacik S, Balagurunathan Y, Bernard N, Brengues M, Faggioni G, et al. NATO BIODOSIMETRY STUDY: laboratory intercomparison of gene expression assays. Radiat Res. 2013;180(2):138–148. doi: 10.1667/RR3236.1. - DOI - PMC - PubMed

MeSH terms

Substances