. 2021 May 3;22(1):133.
doi: 10.1186/s13059-021-02318-x.

Functional and genetic determinants of mutation rate variability in regulatory elements of cancer genomes

Affiliations

Functional and genetic determinants of mutation rate variability in regulatory elements of cancer genomes

Christian A Lee et al. Genome Biol. .

Abstract

Background: Cancer genomes are shaped by mutational processes with complex spatial variation at multiple scales. Entire classes of regulatory elements are affected by local variations in mutation frequency. However, the underlying mechanisms with functional and genetic determinants remain poorly understood.

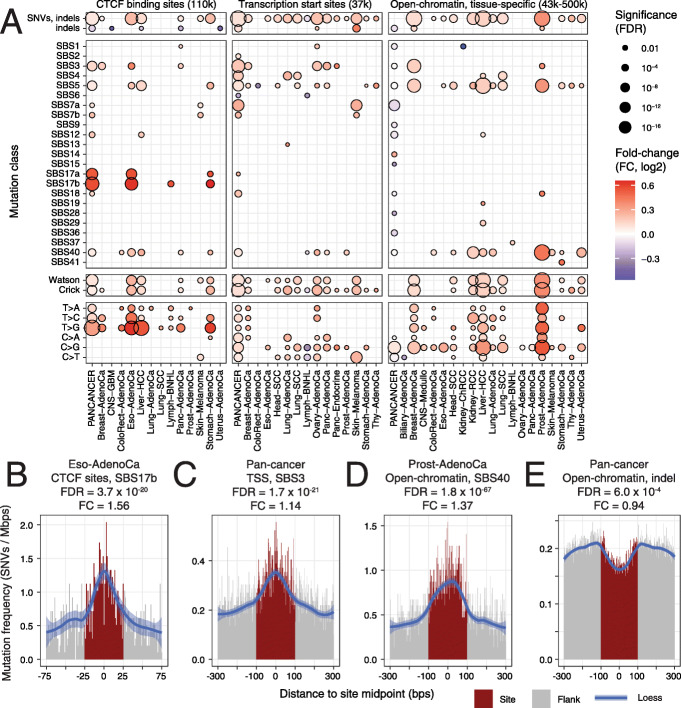
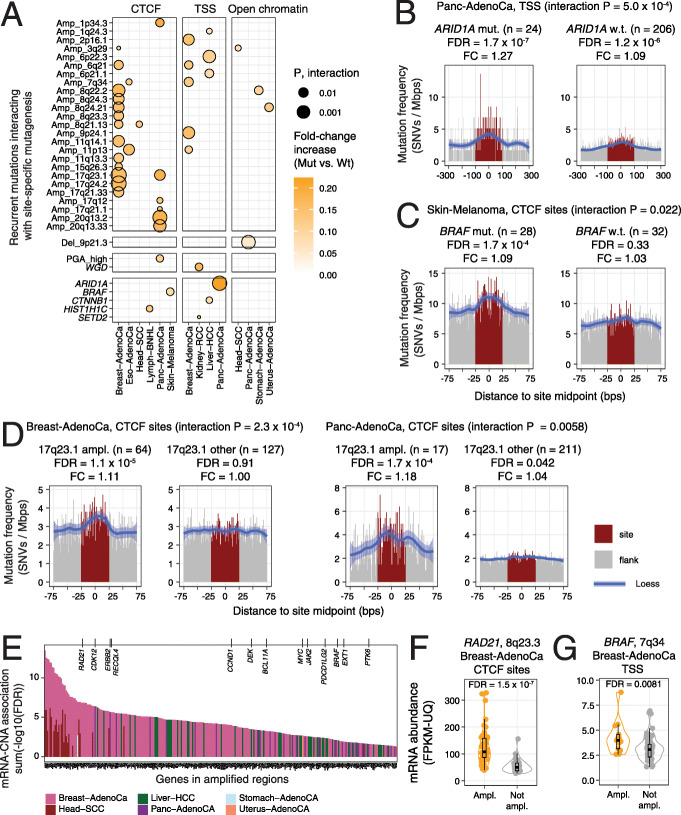
Results: We characterise the mutational landscape of 1.3 million gene-regulatory and chromatin architectural elements in 2419 whole cancer genomes with transcriptional and pathway activity, functional conservation and recurrent driver events. We develop RM2, a statistical model that quantifies mutational enrichment or depletion in classes of genomic elements through genetic, trinucleotide and megabase-scale effects. We report a map of localised mutational processes affecting CTCF binding sites, transcription start sites (TSS) and tissue-specific open-chromatin regions. Increased mutation frequency in TSSs associates with mRNA abundance in most cancer types, while open-chromatin regions are generally enriched in mutations. We identify ~ 10,000 CTCF binding sites with core DNA motifs and constitutive binding in 66 cell types that represent focal points of mutagenesis. We detect site-specific mutational signature enrichments, such as SBS40 in open-chromatin regions in prostate cancer and SBS17b in CTCF binding sites in gastrointestinal cancers. Candidate drivers of localised mutagenesis are also apparent: BRAF mutations associate with mutational enrichments at CTCF binding sites in melanoma, and ARID1A mutations with TSS-specific mutagenesis in pancreatic cancer.

Conclusions: Our method and catalogue of localised mutational processes provide novel perspectives to cancer genome evolution, mutagenesis, DNA repair and driver gene discovery. The functional and genetic correlates of mutational processes suggest mechanistic hypotheses for future studies.


Conflict of interest statement

The authors declare that they have no competing interests.

Figures

Fig. 1
Fig. 1
Characterising local mutational processes with RM2. a Method overview. RM2 studies a set of genomic elements (i.e. sites) and somatic mutations in cancer genomes using a negative binomial regression model. Sites of constant genomic width (dark grey) and two control flanking sequences (light grey) are used (isSite). Sites and flanks are collapsed into unique nucleotides and grouped to ten bins using their megabase-scale mutation frequency (MbpRate). Mutations in sites and flanks (nMut) are grouped by trinucleotide type (triNucMutClass). Trinucleotide content corresponding to the potential genomic space for mutations is used as model offset (nPosits). Log-likehood tests are used to compare the mutation frequencies in sites and flanking regions by removing the model factor isSite. The optional factor coFac enables interaction analysis of genetic and clinical variables. b QQ-plot shows the observed and expected P values of true and simulated mutations from PCAWG. No significant signals were identified in simulated data (FDR < 0.05), indicating that our method is well-calibrated. c Comparison of model performance with and without MbpRate covariate. Analysis of true (left) and simulated mutations (right) shows the advantage of modelling megabase-scale mutation frequency. d Power analysis of RM2 using down-sampling of CTCF binding sites and liver cancer genomes. Fraction of significant results (left) and median P value (right) are shown. Panels b and c include total mutations, strands- and signature-specific mutations as in Fig. 3. Only total mutations were included for analyses in c, d
Fig. 2
Fig. 2
Comprehensive map of mutational processes in gene-regulatory and chromatin architectural elements of cancer genomes. a Comparison of mutation frequencies in DNA-binding sites of the CTCF chromatin architectural factor (left), transcription start sites (TSS) and cancer-specific open-chromatin sites in 2419 whole cancer genomes (FDR < 0.05). Total mutations (SNVs, indels) and mutations grouped by single-base substitution (SBS) signatures, substitution types and DNA strand were analysed. Open-chromatin sites were filtered to exclude TSSs and CTCF sites. b–e Examples of localised mutation frequencies and signatures: b Enrichment of SBS17B in CTCF binding sites in oesophageal adenocarcinoma, c pan-cancer enrichment of SBS3 mutations in TSSs, d enrichment of SBS40 mutations in open-chromatin sites in prostate adenocarcinoma, e pan-cancer depletion of indel mutations in open-chromatin sites
Fig. 3
Fig. 3
Mutational enrichment at transcription start sites associates with mRNA abundance of target genes and diverse pathways. a Comparison of mutation frequencies in TSSs and tissue-specific open-chromatin sites grouped by mRNA abundance of target genes in matching tumours (FDR < 0.05). Equal numbers of sites were sampled for an unbiased comparison. b Examples of cancer types with strong transcription-associated mutagenesis in TSSs (top) compared to open-chromatin sites (bottom). Mutation frequencies are shown on the Y-axis with loess smoothing. c Median mRNA abundance of genes in the five bins. d Enrichment map of pathways and processes with frequent mutations at TSSs (FDR < 0.05). Nodes represent pathways and processes that are connected with edges if these include many common genes
Fig. 4
Fig. 4
Localised mutational processes at constitutively active binding sites of CTCF. a Histogram of CTCF binding sites with number of cell lines in ENCODE. Sites were grouped as five equal bins based on conservation across cell lines (colours). Bimodal distribution reveals a subset of sites detected in most or all cell types (in red). b Pie charts show the proportion of CTCF sites in the five bins located at chromatin loop anchors (left) and that matched the core CTCF motif (right). P values represent the enrichment in the 5th bin compared to all sites (Fisher’s exact test). The median numbers of cell lines per bin are shown in brackets. c Significance of the localised mutational enrichments in the five bins CTCF binding sites. FDR values of the RM2 analysis shown on the X-axis. Colours correspond to cancer types. d Local mutation frequency in the five bins of CTCF binding sites. Solid lines show statistically significant changes in mutation frequencies compared to flanking controls (RM2 FDR < 0.05). Loess curves were used for smoothing. e Significance of mutational enrichment in highly conserved CTCF binding sites (bins 4–5) grouped by presence or absence of core DNA-binding motif of CTCF in the sites. f Mutations in constitutively bound subsets in CTCF binding sites with and without the core CTCF DNA motifs. Oesophageal cancer (left) and liver cancer (right) are compared
Fig. 5
Fig. 5
Recurrent driver mutations and copy-number alterations (CNA) associate with localised mutagenesis. a Dotplot of the statistical interactions of recurrent mutations with increased mutation frequencies at sites (RM2 FDR < 0.05: interaction P < 0.05). Whole-genome duplication (WGD) and CNA burden (median-dichotomised percent genome altered, PGA) are also shown. bd Examples of increased mutation frequency associating with recurrent driver mutations and CNAs. Tumours with and without recurrent mutations are shown (left vs right). b ARID1A mutations in pancreatic cancer associate with enriched mutations at TSSs. c BRAF mutations in melanoma associate with enriched mutations at CTCF binding sites. d 17q23.1 amplifications associate with enriched mutations at CTCF binding sites in breast and pancreatic cancer. e Copy-number amplified genes with amplification-driven increases in mRNA abundance. Known cancer genes are shown at the top. f RAD21 is upregulated in the set of 8q23.3-amplified breast cancers associated with enriched mutations in CTCF binding sites. g BRAF is upregulated in the set of 7q34-amplified breast cancers associated with enriched mutations in TSSs

References

    1. Stratton MR, Campbell PJ, Futreal PA. The cancer genome. Nature. 2009;458(7239):719–724. - PMC - PubMed
    1. Vogelstein B, Papadopoulos N, Velculescu VE, Zhou S, Diaz LA, Kinzler KW. Cancer genome landscapes. Science. 2013;339(6127):1546–1558. - PMC - PubMed
    1. ICGC-TCGA Pan-Cancer Analysis of Whole Genomes Consortium Pan-cancer analysis of whole genomes. Nature. 2020;578:82–93. - PMC - PubMed
    1. Rheinbay E, et al. Analyses of non-coding somatic drivers in 2,693 cancer whole genomes. Nature. 2020;578(7793):102–111. - PMC - PubMed
    1. Bailey MH, et al. Comprehensive characterization of Cancer driver genes and mutations. Cell. 2018;174(4):1034–5. 10.1016/j.cell.2018.07.034. - PMC - PubMed

Publication types

Grants and funding