. 2021 May 4:10:e57849.
doi: 10.7554/eLife.57849.

Whole-genome sequencing analysis of semi-supercentenarians

Affiliations

Whole-genome sequencing analysis of semi-supercentenarians

Paolo Garagnani et al. Elife. .

Abstract

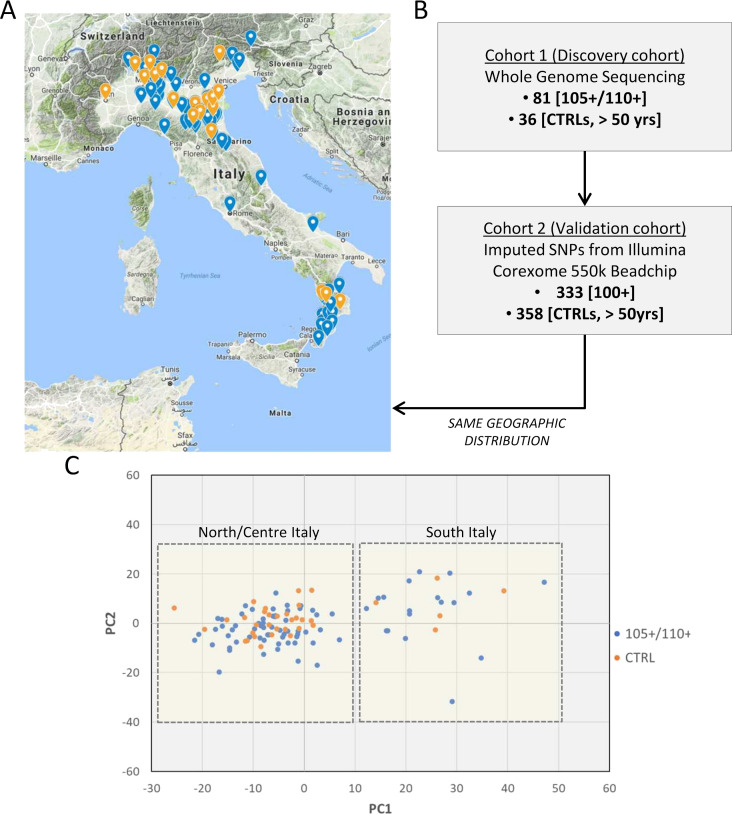
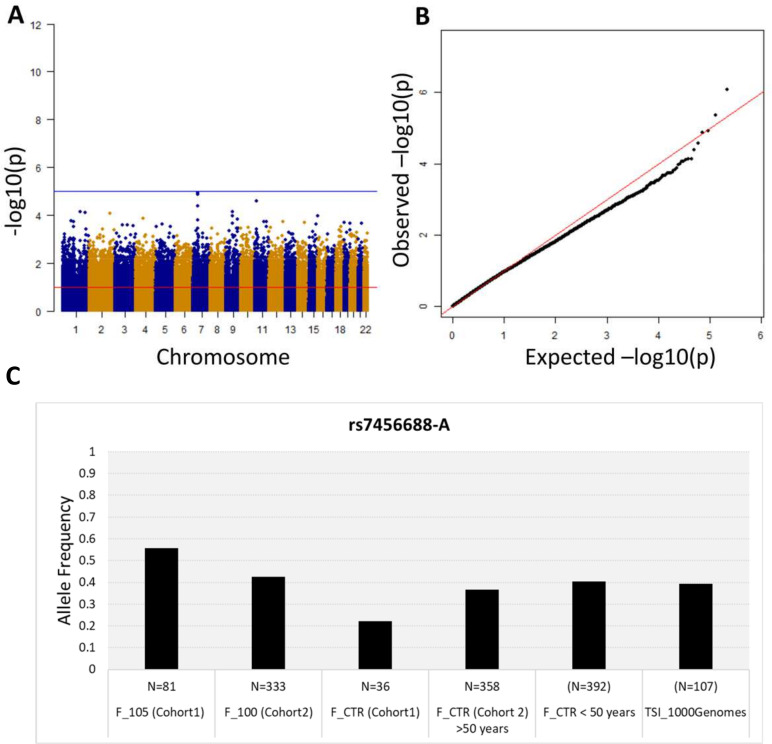
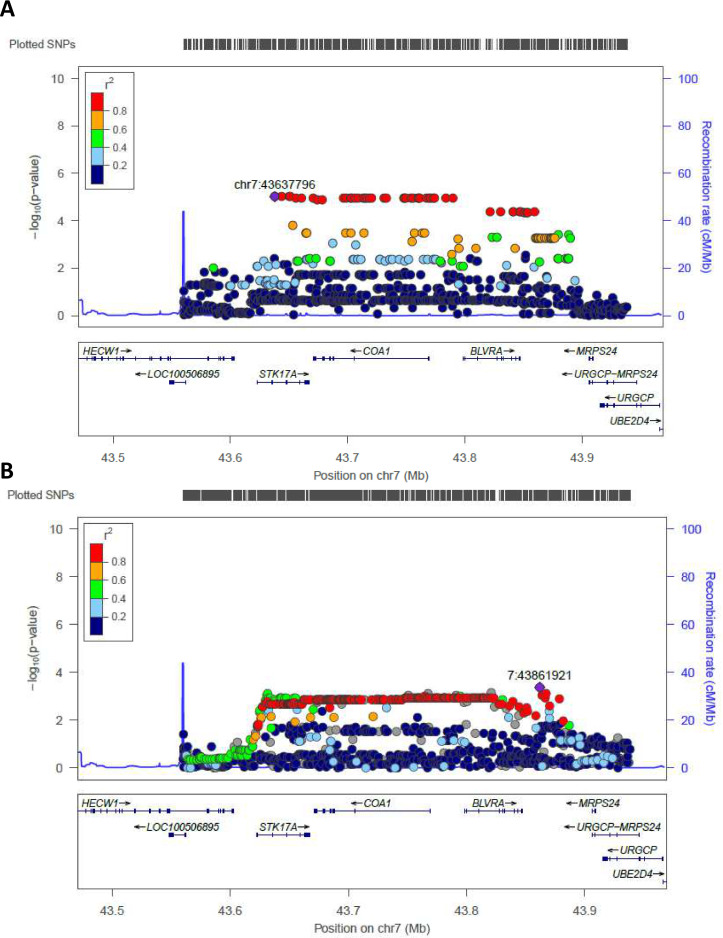
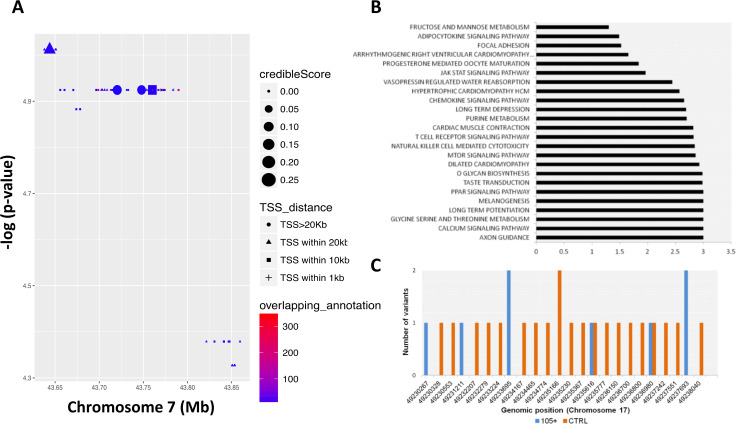
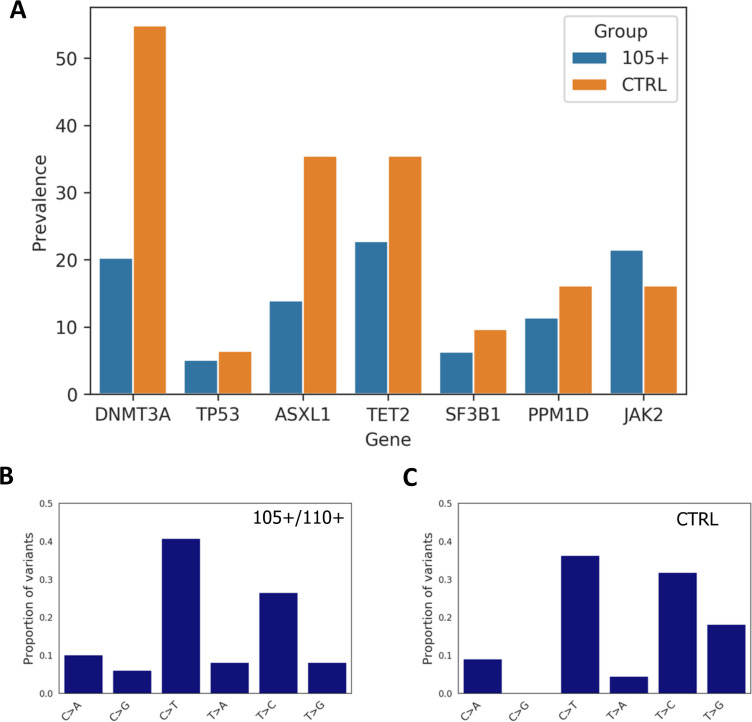
Extreme longevity is the paradigm of healthy aging as individuals who reached the extreme decades of human life avoided or largely postponed all major age-related diseases. In this study, we sequenced at high coverage (90X) the whole genome of 81 semi-supercentenarians and supercentenarians [105+/110+] (mean age: 106.6 ± 1.6) and of 36 healthy unrelated geographically matched controls (mean age 68.0 ± 5.9) recruited in Italy. The results showed that 105+/110+ are characterized by a peculiar genetic background associated with efficient DNA repair mechanisms, as evidenced by both germline data (common and rare variants) and somatic mutations patterns (lower mutation load if compared to younger healthy controls). Results were replicated in a second independent cohort of 333 Italian centenarians and 358 geographically matched controls. The genetics of 105+/110+ identified DNA repair and clonal haematopoiesis as crucial players for healthy aging and for the protection from cardiovascular events.

Keywords: ageing; clonal hematopoiesis; genetics; genomics; geroscience; human; longevity; semi-supercentenarians; sequencing.


Conflict of interest statement

PG, MD, CP, EM, KK, VI, LX, DM, BA, MC, EF, DM, BN, SS, DL, DP, GC, CS, GP, FD, PD, LB, NM, DG, OO, CG, CF No competing interests declared, JM, AV, JC, FR, SC, PD is affiliated with Nestlé Research, Société des Produits Nestlé SA. The author has no other competing interests to declare. MB s affiliated with Nestlé Research, Société des Produits Nestlé SA. The author has no other competing interests to declare. AF is affiliated with Menarini Silicon Biosystems SpA. The author has no other competing interests to declare.

Figures

Figure 1.
Figure 1.. Study design.
(A) 105+/110+ (in blue) and controls (in orange) recruited in the Italian peninsula and analyzed by whole genome sequencing (discovery cohort). (B) The study design applied in the present study. (C) PCA plot for the discovery cohort (Cohort 1), in red are indicated 105+/110+ and in black the group of controls (CTRL).
Figure 2.
Figure 2.. Association analysis results considering common variants (MAF >5%).
(A) Manhattan plot for all the SNPs tested for the association analysis by considering semi-supercentenarians and controls. The x-axis shows SNPs according to their chromosomal positions and y-axis shows the p-values, expressed as –log10(p-value). (B) QQ plot of expected –log10(p-values) (x axis) versus observed –log10(p-values) (y axis) (one black point per variant). The genomic inflation factor was estimated to 1.02. (C) Allele frequency of rs7456688-A in all the cohorts analyzed.
Figure 2—figure supplement 1.
Figure 2—figure supplement 1.. eQTL violin plot for rs623108 (chr7: 43864699) identified in a previous longevity study of the Italian population Giuliani et al., 2018b and replicated in the present study.
The rs623108-A allele correlates with rs7456688-A (moderate LD r2 = 0.58 in European populations of 1000Genomes). Data Source: GTEx Analysis Release V8.
Figure 3.
Figure 3.. Regional association plot made by LocusZoom.
Regional plots for the most significant region comparing semi-supercentenarians and controls for the Cohort 1, that is discovery cohort (A) and for the validation cohort (B). Each point indicates the p-value for one SNP, the x-axis indicates the genomic localization of the variant and the y-axis indicates the -log10(p-value) from the association analysis. The recombination rate is plotted and indicated in the y-axis. Both plots show the same genomic positions, from chr7:43560257 to chr7:43938230 (GRCH37/hg19).
Figure 4.
Figure 4.. Common and rare variants analysis.
(A) Common variants in COA1 gene and output of the Bayesian model RiVIERA (Risk Variant Inference using Epigenomic Reference Annotations). The SNPs are shown as a function of their position on chromosome 7. The symbol (dot, rectangle, triangle) indicates the distance to the transcription start site (TSS). The size of the symbol reflects the credible score which exhibit an higher probability of regulatory properties. The colour (indicated as ‘overlapping_annotation’) indicates the total number of epigenomic marks that co-localize with the SNP. (B) KEGG Pathways analysis was performed using i-GSEA4GWAS. -log(FDR value) were indicating for each significant pathways (<0.01). (C) Number of rare variants in the NME1, NME1-NME2 region. Genomic positions were reported in x-axis while the number of variants for each position is reported in y-axis. The number of rare variants in 105+/110+ is reported in blue and in CTRL in orange.
Figure 4—figure supplement 1.
Figure 4—figure supplement 1.. Number of private mutations for each 105+/110+.
Y-axes reported the prevalence and x-axes the number of mutations.
Figure 5.
Figure 5.. Prevalence of somatic mutations.
(A) Prevalence of somatic mutations in 105+/110+ and controls considering the seven genes analysed. (B,C) the distribution of single-nucleotide substitutions types observed in 105+/110+ and CTRL.
Figure 5—figure supplement 1.
Figure 5—figure supplement 1.. Allelic fraction distribution of the somatic mutations observed.
Figure 5—figure supplement 2.
Figure 5—figure supplement 2.. Boxplot with Polygenic risk scores (PRS) calculated according to different SNPs list identified from previous publication and applied to 105+/110+ and CTRL.
The y-axes reported the value of the score calculated in 105+/110+ (in blue) and in CTRL (in red).
Author response image 1.
Author response image 1.. The identified area (STK17A) was reported for two centenarians as an example.
All the other data are uniform and comparable to this picture.
Author response image 2.
Author response image 2.. The identified area (STK17A) was reported for two controls as an example.
All the other data are uniform and comparable to this picture.

References

    1. Andersen SL, Sebastiani P, Dworkis DA, Feldman L, Perls TT. Health span approximates life span among many supercentenarians: compression of morbidity at the approximate limit of life span. The Journals of Gerontology Series A: Biological Sciences and Medical Sciences. 2012;67A:395–405. doi: 10.1093/gerona/glr223. - DOI - PMC - PubMed
    1. Anderson CA, Pettersson FH, Clarke GM, Cardon LR, Morris AP, Zondervan KT. Data quality control in genetic case-control association studies. Nature Protocols. 2010;5:1564–1573. doi: 10.1038/nprot.2010.116. - DOI - PMC - PubMed
    1. Beekman M, Nederstigt C, Suchiman HE, Kremer D, van der Breggen R, Lakenberg N, Alemayehu WG, de Craen AJ, Westendorp RG, Boomsma DI, de Geus EJ, Houwing-Duistermaat JJ, Heijmans BT, Slagboom PE. Genome-wide association study (GWAS)-identified disease risk alleles do not compromise human longevity. PNAS. 2010;107:18046–18049. doi: 10.1073/pnas.1003540107. - DOI - PMC - PubMed
    1. Bonafè M, Olivieri F, Mari D, Baggio G, Mattace R, Sansoni P, De Benedictis G, De Luca M, Bertolini S, Barbi C, Monti D, Franceschi C. p53 variants predisposing to Cancer are present in healthy centenarians. The American Journal of Human Genetics. 1999;64:292–294. doi: 10.1086/302196. - DOI - PMC - PubMed
    1. Browning SR. Multilocus association mapping using variable-length markov chains. The American Journal of Human Genetics. 2006;78:903–913. doi: 10.1086/503876. - DOI - PMC - PubMed

Publication types

LinkOut - more resources