Clinical Trial
. 2021 Oct;11(10):2474-2487.
doi: 10.1158/2159-8290.CD-20-1557. Epub 2021 May 3.

Impact of HER2 Heterogeneity on Treatment Response of Early-Stage HER2-Positive Breast Cancer: Phase II Neoadjuvant Clinical Trial of T-DM1 Combined with Pertuzumab

Affiliations
Clinical Trial

Impact of HER2 Heterogeneity on Treatment Response of Early-Stage HER2-Positive Breast Cancer: Phase II Neoadjuvant Clinical Trial of T-DM1 Combined with Pertuzumab

Otto Metzger Filho et al. Cancer Discov. 2021 Oct.

Abstract

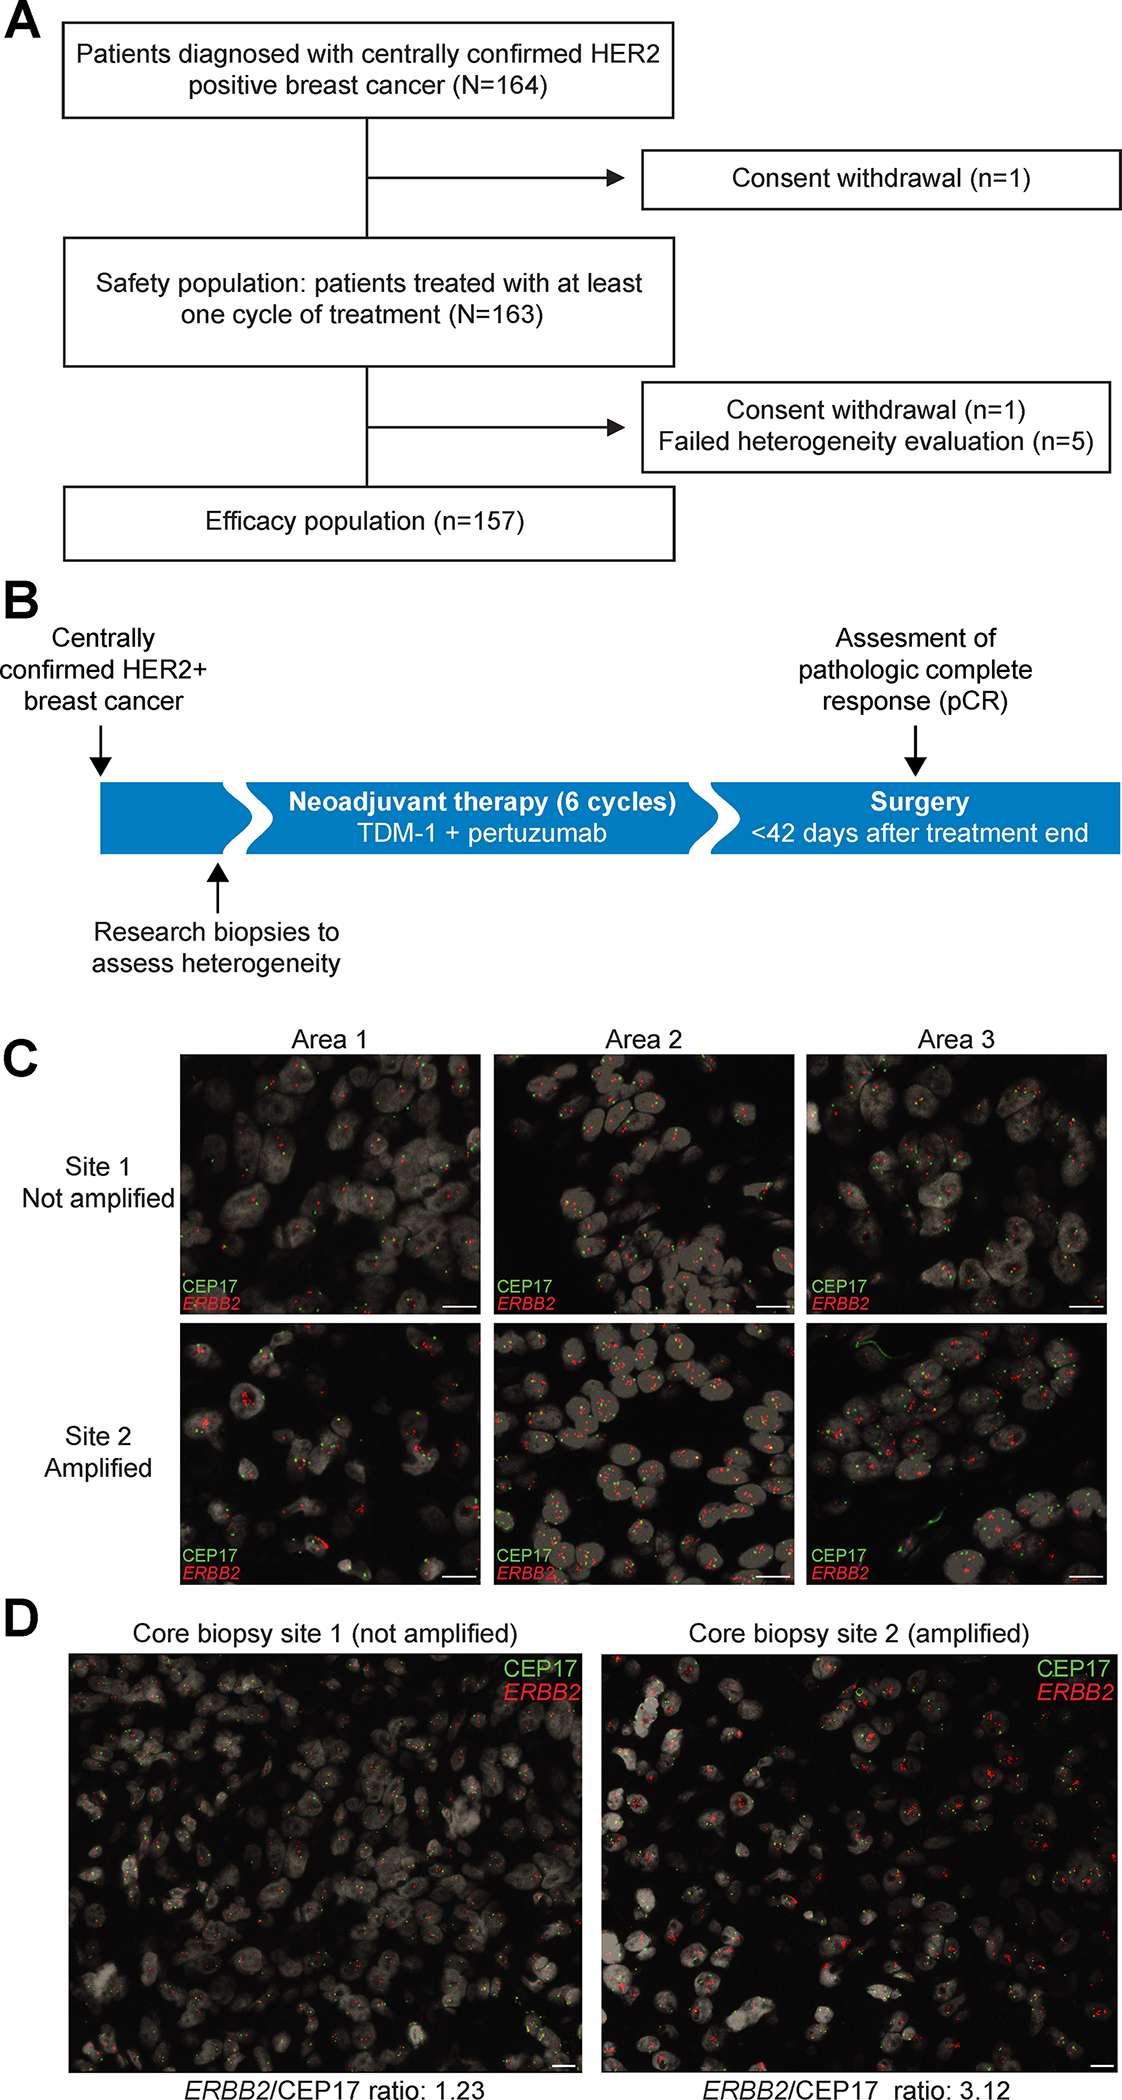
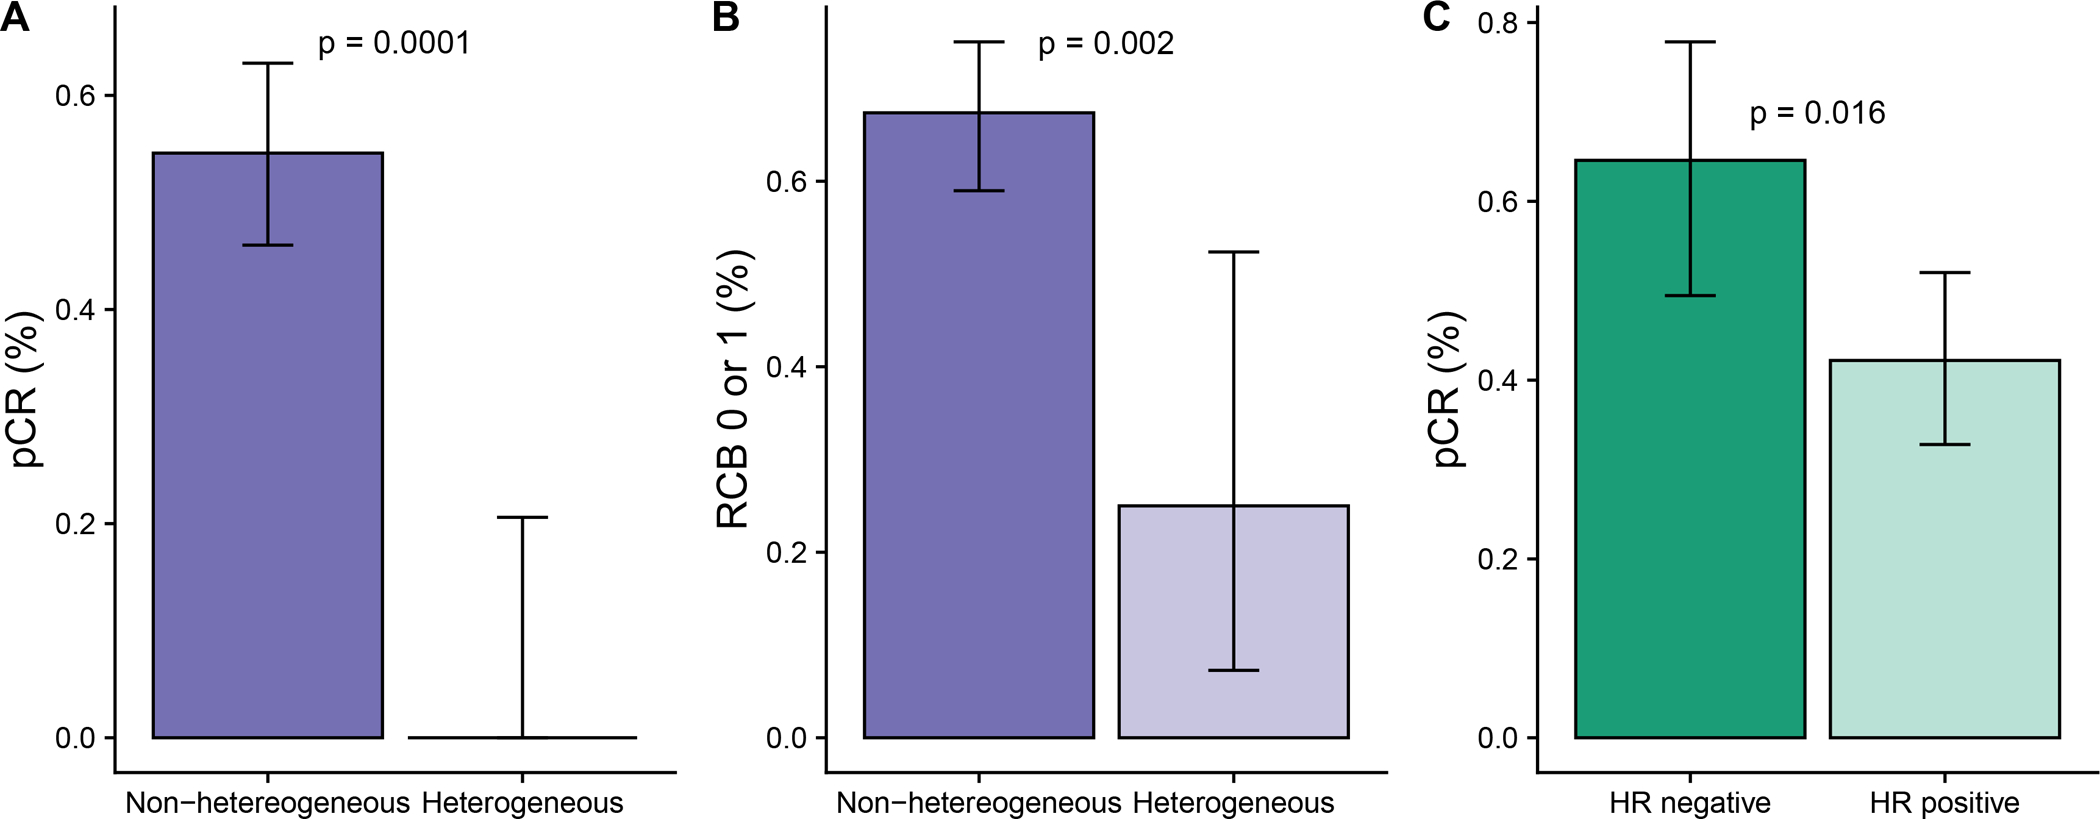
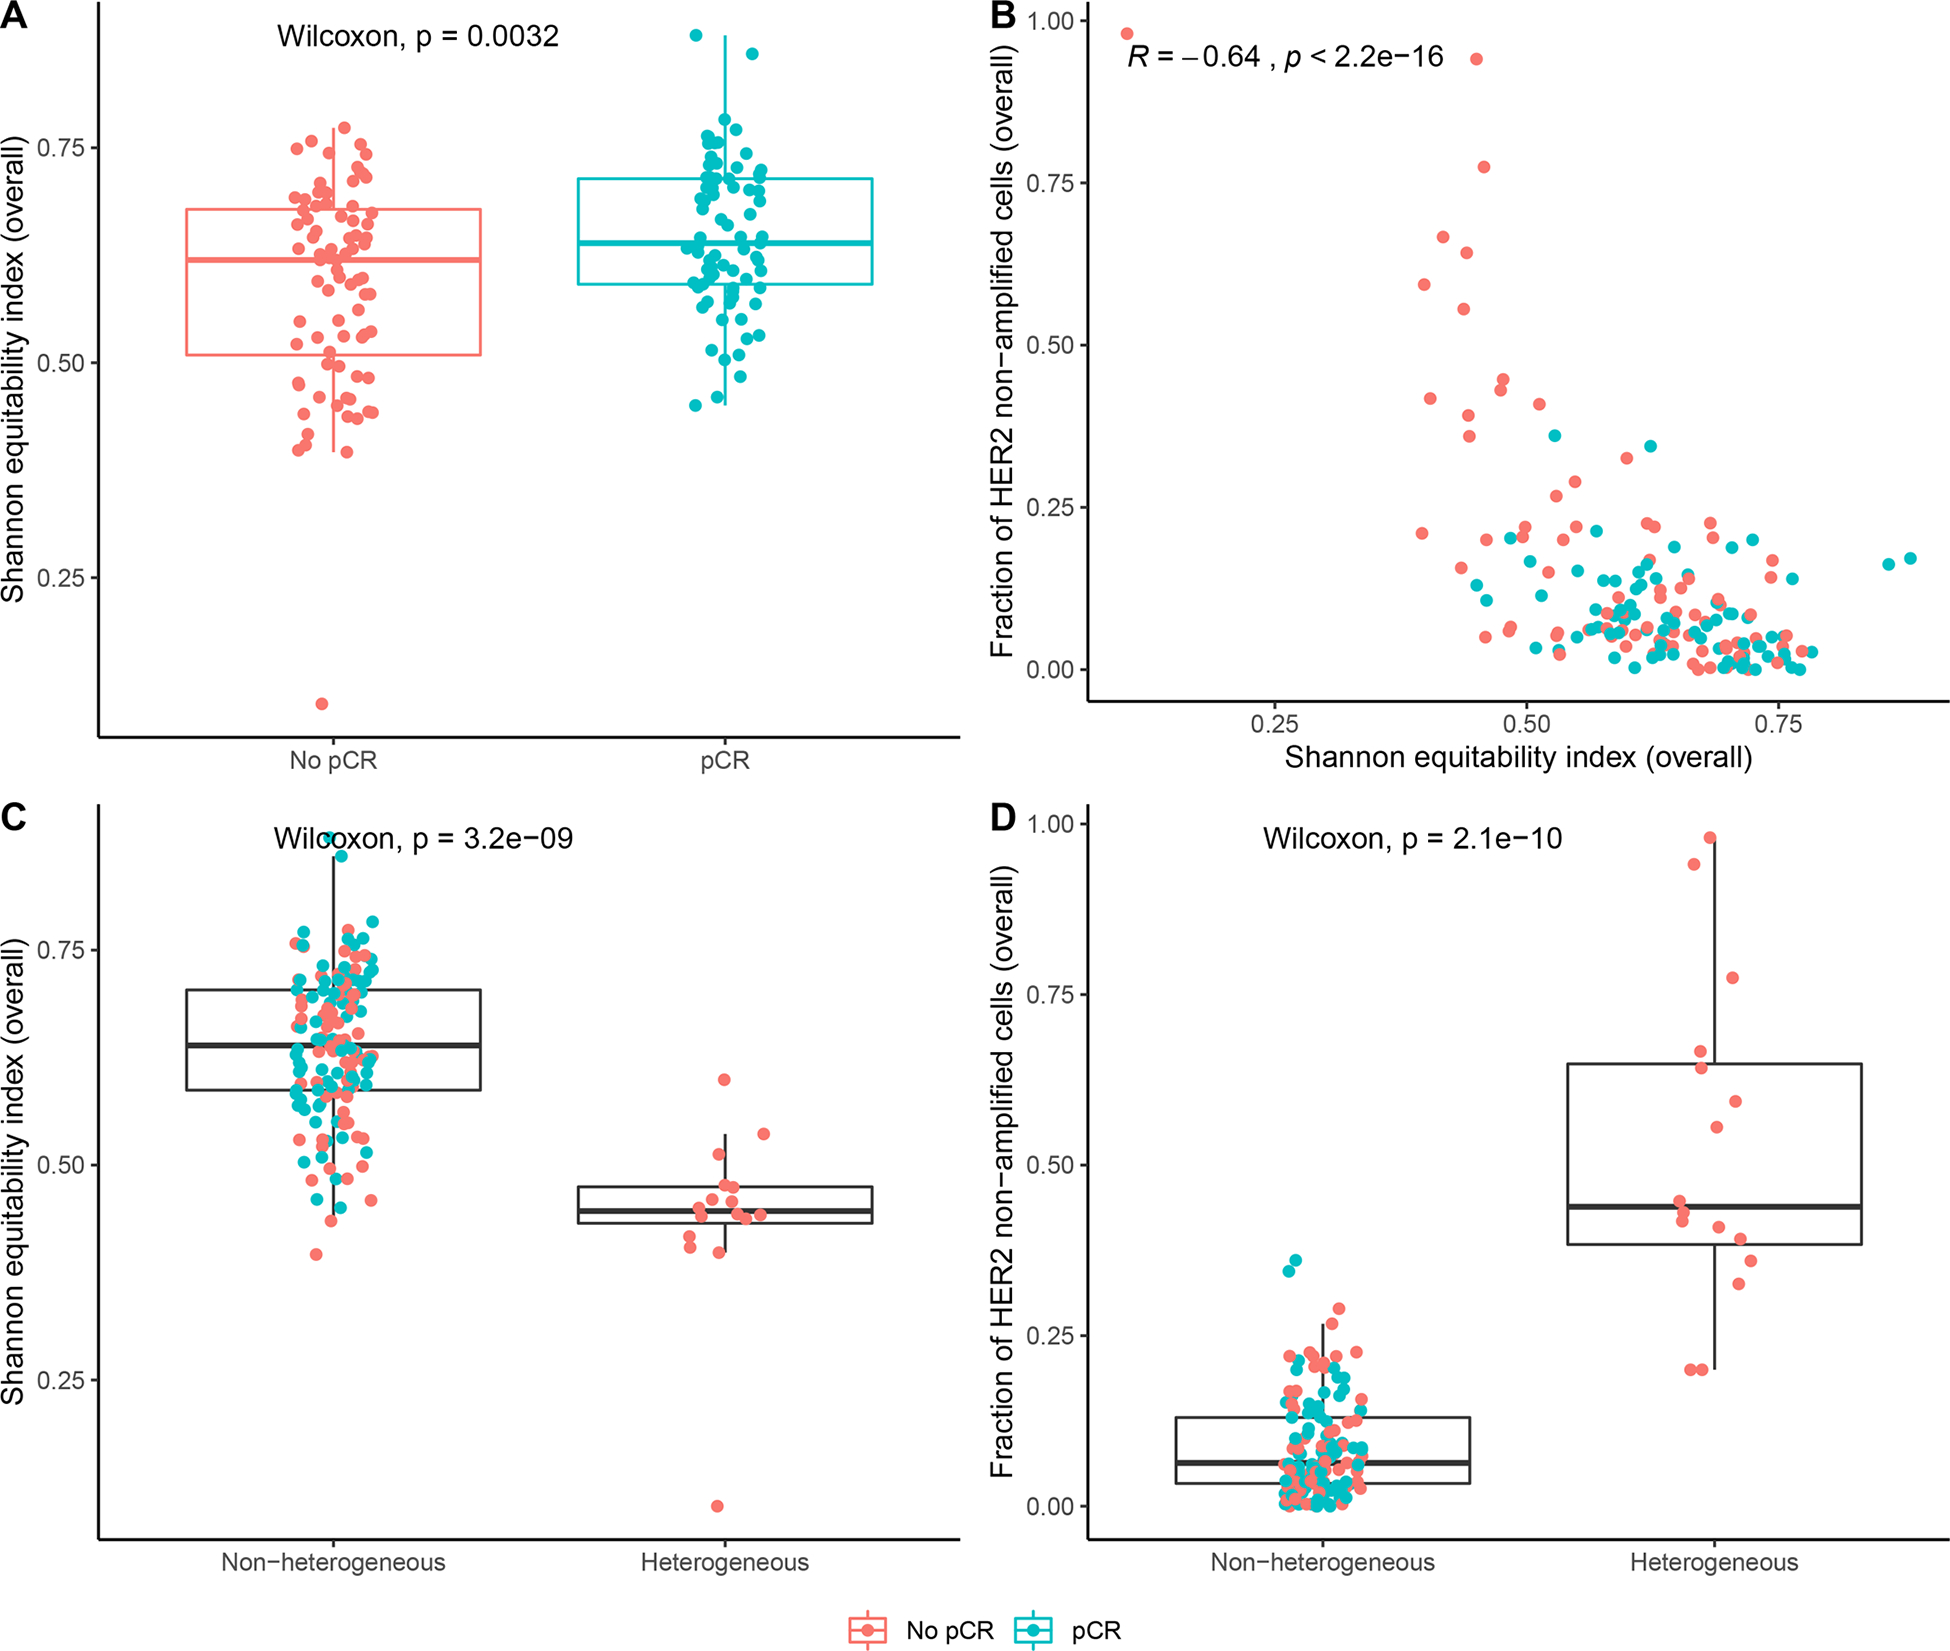
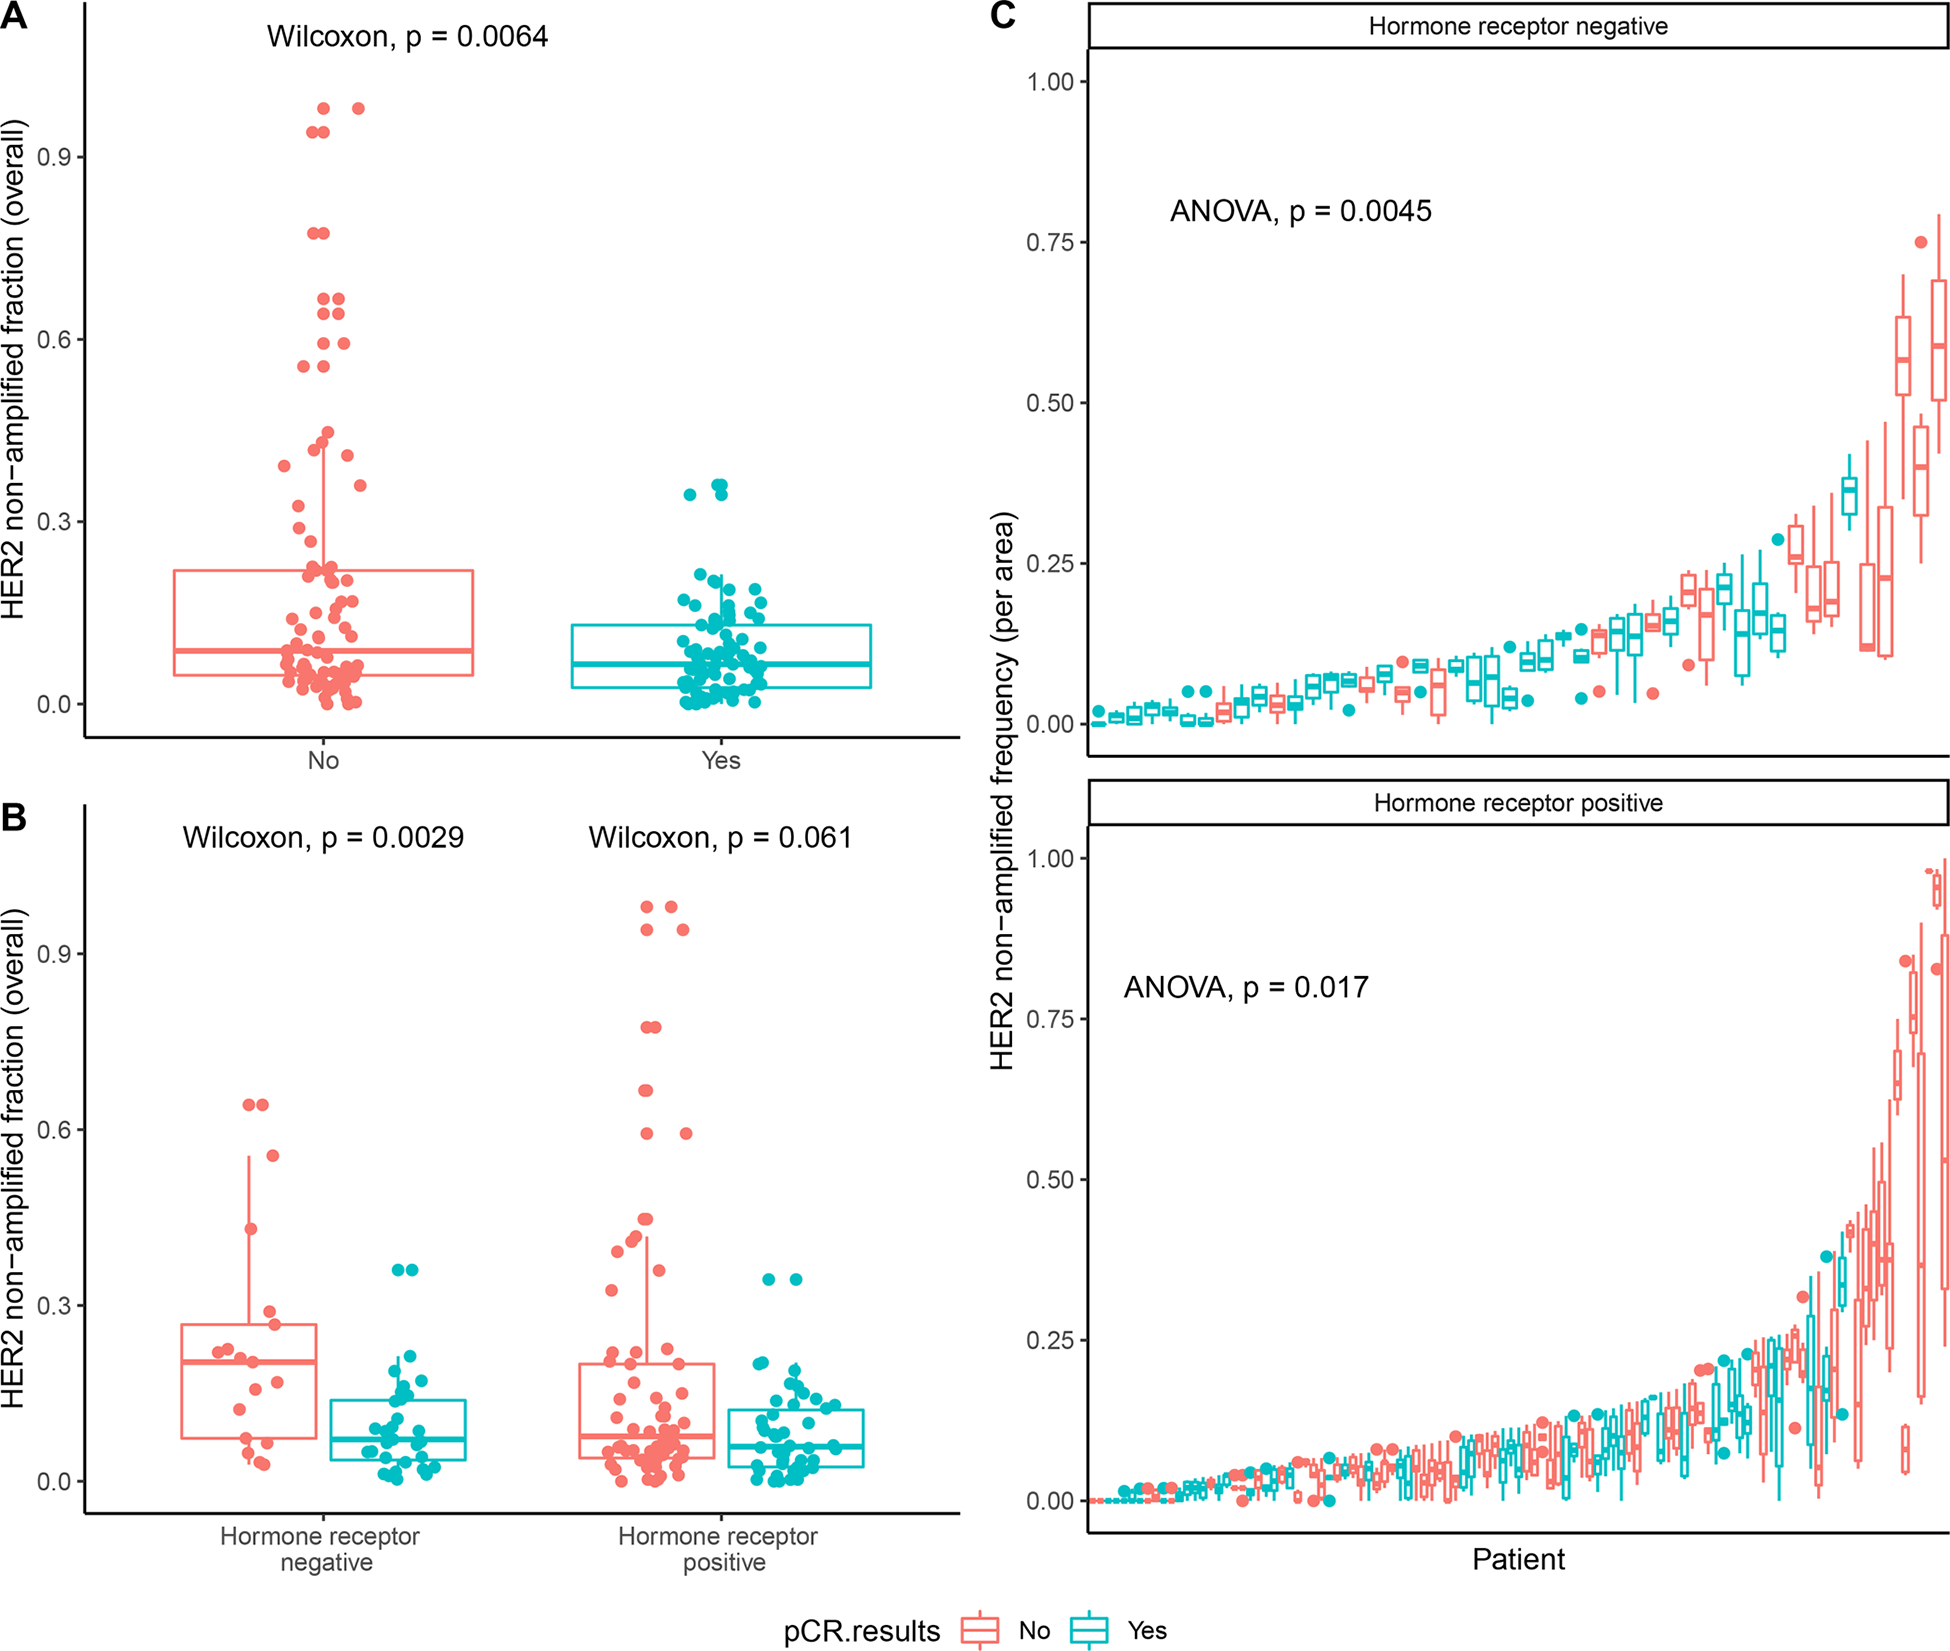
Intratumor heterogeneity is postulated to cause therapeutic resistance. To prospectively assess the impact of HER2 (ERBB2) heterogeneity on response to HER2-targeted therapy, we treated 164 patients with centrally confirmed HER2-positive early-stage breast cancer with neoadjuvant trastuzumab emtansine plus pertuzumab. HER2 heterogeneity was assessed on pretreatment biopsies from two locations of each tumor. HER2 heterogeneity, defined as an area with ERBB2 amplification in >5% but <50% of tumor cells, or a HER2-negative area by FISH, was detected in 10% (16/157) of evaluable cases. The pathologic complete response rate was 55% in the nonheterogeneous subgroup and 0% in the heterogeneous group (P < 0.0001, adjusted for hormone receptor status). Single-cell ERBB2 FISH analysis of cellular heterogeneity identified the fraction of ERBB2 nonamplified cells as a driver of therapeutic resistance. These data suggest HER2 heterogeneity is associated with resistance to HER2-targeted therapy and should be considered in efforts to optimize treatment strategies. SIGNIFICANCE: HER2-targeted therapies improve cure rates in HER2-positive breast cancer, suggesting chemotherapy can be avoided in a subset of patients. We show that HER2 heterogeneity, particularly the fraction of ERBB2 nonamplified cancer cells, is a strong predictor of resistance to HER2 therapies and could potentially be used to optimize treatment selection.See related commentary by Okines and Turner, p. 2369.This article is highlighted in the In This Issue feature, p. 2355.


Figures

Figure 1.
Figure 1.. Study Design.
A, CONSORT diagram. B, Study design. Centrally confirmed HER2-positive breast cancer patients were treated in a single arm study. Treatment consisted of six infusions of T-DM1 given in combination with pertuzumab. C, Example of central pathology evaluation of HER2 heterogeneity assessed by FISH, with CEP17 probe in green and ERBB2 in red. ERBB2 copy number counting was performed in three different areas per core biopsy site counting approximately 50 cells in each area. Scale bar corresponds to 10 μm. D, A representative case of HER2 heterogeneity with core biopsy site 1 showing HER2-negative cancer and core biopsy site 2 HER2-amplified cancer. Scale bar corresponds to 10 μm.
Figure 2.
Figure 2.. Pathological response according to HER2 heterogeneity and hormone receptor status.
The mean and 95% confidence interval of the mean is shown in each graph. A, pCR by HER2 heterogeneity. B, Pathological response defined as RCB 0 or I by HER2 heterogeneity. C, pCR by hormone receptor (HR) status for the overall study population. A-C, P-values are from a χ2 test.
Figure 3.
Figure 3.. Assessment of HER2 heterogeneity at the single cell level.
A, Shannon equitability index for each patient, separated by response. P-value is from a Wilcoxon test. B, Shannon equitability index (x-axis) vs. frequency of ERBB2 non-amplified cells. Each datapoint represents one patient. R and p-value are from a Pearson correlation test of association. Red represents non-responders and blue represents responders. C, Shannon equitability index for each patient, separated by central pathology evaluation of HER2 heterogeneity. P-value is from a Wilcoxon test. D, Frequency of ERBB2 non-amplified cells in each patient, separated by central pathology evaluation of HER2 heterogeneity. P-value is from a Wilcoxon test. A, C-D, The lower and upper hinges correspond to the 1st and 3rd quartiles, respectively. The lower and upper whiskers extend to the smallest and largest values, respectively, no further than 1.5*IQR from the hinge, where the IQR is the distance between the 1st and 3rd quartiles. All data points are plotted.
Figure 4.
Figure 4.. Association between HER2 negativity and pathologic complete response (pCR).
A, Fraction of ERBB2 non-amplified cells in each patient. P-value is from a Wilcoxon test. B, Fraction of ERBB2 non-amplified cells in each patient separated by HR status: HR-negative cases and HR-positive cases. P-values are from a Wilcoxon test. C, Frequency of ERBB2 non-amplified cells in each patient separated by HR status: HR-negative patients (top) and HR-positive cases (bottom). Each boxplot shows the fraction of HER2 non-amplified cells in each area for one patient, where patients are ordered by the maximum fraction of ERBB2 non-amplified cells found in any area and stratified by hormone receptor status. Responders (i.e., patients achieving pCR) are enriched on the left side of the plot with a lower fraction of ERBB2 non-amplified cells, and non-responders are enriched on the right side of the plot with a higher fraction of ERBB2 non-amplified cells. P-values are from an F-test with Satterthwaite’s method. A-C, Red represents patients without pCR and blue represents pateints with pCR. The lower and upper hinges correspond to the 1st and 3rd quartiles, respectively. The lower and upper whiskers extend to the smallest and largest values, respectively, no further than 1.5*IQR from the hinge, where the IQR is the distance between the 1st and 3rd quartiles. All data points are plotted in A-B, and data points outside of the whiskers are plotted separately in C.

Comment in

References

    1. Marusyk A, Janiszewska M, Polyak K. Intratumor Heterogeneity: The Rosetta Stone of Therapy Resistance. Cancer Cell 2020;37(4):471–84 doi 10.1016/j.ccell.2020.03.007. - DOI - PMC - PubMed
    1. King CR, Kraus MH, Aaronson SA. Amplification of a novel v-erbB-related gene in a human mammary carcinoma. Science 1985;229(4717):974–6. - PubMed
    1. Slamon DJ, Clark GM, Wong SG, Levin WJ, Ullrich A, McGuire WL. Human breast cancer: correlation of relapse and survival with amplification of the HER-2/neu oncogene. Science 1987;235(4785):177–82. - PubMed
    1. Hayes DF. HER2 and Breast Cancer - A Phenomenal Success Story. N Engl J Med 2019;381(13):1284–6 doi 10.1056/NEJMcibr1909386. - DOI - PubMed
    1. von Minckwitz G, Huang CS, Mano MS, Loibl S, Mamounas EP, Untch M, et al. Trastuzumab Emtansine for Residual Invasive HER2-Positive Breast Cancer. N Engl J Med 2019;380(7):617–28 doi 10.1056/NEJMoa1814017. - DOI - PubMed

Publication types

MeSH terms