. 2021 Jun 15;81(12):3200-3214.
doi: 10.1158/0008-5472.CAN-20-3317. Epub 2021 May 3.

Inhibition of Jumonji Histone Demethylases Selectively Suppresses HER2+ Breast Leptomeningeal Carcinomatosis Growth via Inhibition of GMCSF Expression

Affiliations

Inhibition of Jumonji Histone Demethylases Selectively Suppresses HER2+ Breast Leptomeningeal Carcinomatosis Growth via Inhibition of GMCSF Expression

Arunoday Bhan et al. Cancer Res. .

Abstract

HER2+ breast leptomeningeal carcinomatosis (HER2+ LC) occurs when tumor cells spread to cerebrospinal fluid-containing leptomeninges surrounding the brain and spinal cord, a complication with a dire prognosis. HER2+ LC remains incurable, with few treatment options. Currently, much effort is devoted toward development of therapies that target mutations. However, targeting epigenetic or transcriptional states of HER2+ LC tumors might efficiently target HER2+ LC growth via inhibition of oncogenic signaling; this approach remains promising but is less explored. To test this possibility, we established primary HER2+ LC (Lepto) cell lines from nodular HER2+ LC tissues. These lines are phenotypically CD326+CD49f-, confirming that they are derived from HER2+ LC tumors, and express surface CD44+CD24-, a cancer stem cell (CSC) phenotype. Like CSCs, Lepto lines showed greater drug resistance and more aggressive behavior compared with other HER2+ breast cancer lines in vitro and in vivo. Interestingly, the three Lepto lines overexpressed Jumonji domain-containing histone lysine demethylases KDM4A/4C. Treatment with JIB04, a selective inhibitor of Jumonji demethylases, or genetic loss of function of KDM4A/4C induced apoptosis and cell-cycle arrest and reduced Lepto cell viability, tumorsphere formation, regrowth, and invasion in vitro. JIB04 treatment of patient-derived xenograft mouse models in vivo reduced HER2+ LC tumor growth and prolonged animal survival. Mechanistically, KDM4A/4C inhibition downregulated GMCSF expression and prevented GMCSF-dependent Lepto cell proliferation. Collectively, these results establish KDM4A/4C as a viable therapeutic target in HER2+ LC and spotlight the benefits of targeting the tumorigenic transcriptional network. SIGNIFICANCE: HER2+ LC tumors overexpress KDM4A/4C and are sensitive to the Jumonji demethylase inhibitor JIB04, which reduces the viability of primary HER2+ LC cells and increases survival in mouse models.


Figures

Figure 1.
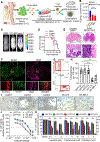
Figure 1.. Derivation and characterization of Lepto cell lines from various nodular HER2+ LC tumor tissues
a) Scheme illustrating the collection of human tumor samples; derivation, and maintenance of Lepto1, Lepto2 and Lepto3 cell lines on collagen-coated plates; scale-up of low passage cell lines followed by in vivo functional characterization; and unbiased tumorsphere viability screening via usage of drugs that target various epigenetic factors/genes. b) Bioluminescence (BLI) based quantification of brain-tropic breast cancer MDA-MB-231 (231-BR), breast to brain metastasis tumor (BBM) cells and HER2+ LC (Lepto1) cells in the brain and spinal cord of xenografted NOD/SCID mouse models. *** <0.001. c) Representative BLI imaging of mice xenografted with 231-BR, BBM and Lepto1 cells in the brain and spinal cord of PDX models. d) Kaplan–Meier survival analyses in days post-implantation showing shorter survival of mice bearing BBM and Lepto1 compared to mice bearing 231-BR cells. e) (Top Panel) Histopathological analysis of the (H&E stained) sagittal section of the brain and axial spinal cord showing Lepto1 deposition in the CNS with invasion of the brain and spinal cord parenchyma. (Bottom panel) H&E staining at higher magnification showing the presence of dark stained Lepto1 cells. f) (Top Panel) IF images of whole brain sections collected from mice 30 days after Lepto1 cell implantation. Imaging of OPCs (Olig2, purple), astrocytes (GFAP, green). (Bottom Panel) Lepto1 cells (mCherry, red) shows a layer of reactive astrocytes on the surface of the brain stem, juxtaposed to nodular HER2+ LC. g) FACS-based analyses showing that ∼95% of Lepto1 cells are CD326+CD49f-, with most of those also CD44+CD24-, indicative of a CSC phenotype. h) Quantification of tumorspheres formed from 100 Lepto1, Lepto2, Lepto3, BT-474, and SK-BR3 cells. Means ± SD of 3 technical and 3 biological replicates are shown. *** p<0.0001. i) Representative images of tumorspheres generated from Lepto1, Lepto2, Lepto3, BT-474, and SK-BR3 cells. Scale bar=100µm j) Dose-response curves of Lepto1, BT-474, and SK-BR3 cells treated 48h with methotrexate. Means ± SD of 3 technical replicates and 3 biological replicates are shown. k) Viability of Lepto1, Lepto2, Lepto3, BT-474, and SK-BR3 cells treated 48 h with various concentrations of lapatinib, trastuzumab, and cytarabine. Means ± SD of 3 technical replicates and 3 biological replicates are shown. * p<0.001
Figure 2.
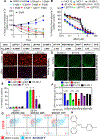
Figure 2.. JIB04 effectively and specifically inhibits viability, invasiveness, tumorsphere formation and growth of HER2+ Lepto lines and enhances their apoptosis
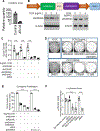
a) Celltitre-Glo based viability analyses demonstrates JIB04 mediated reduction in the Lepto1 cell viability in a dose-and time-dependent manner. Note a significant decrease in the Lepto1 cell viability at concentrations of 50nM and above, in a time-dependent manner. Means ± SD of 3 technical replicates and 3 biological replicates are shown. b) Celltitre-Glo based viability analyses demonstrates JIB04 reduces the viability of Lepto1, Lepto2, and Lepto3 cells, but not other HER2+ and HER2- breast cancer cells, in a dose-dependent manner. Means ± SD of 4 technical replicates and 3 biological replicates are shown. (Bottom table) Showing IC50 values of Lepto1, Lepto2, Lepto3, MCF7, MCF10, SK-BR-3, BT-474, MDA-MB-231, T47D for JIB04 [μM]. c) Representative confocal images of Lepto1, Lepto2 and Lepto3 cells at 10x magnification, stained with Calcein AM-Red and DAPI (for living cells) at 48 h after start of treatment with JIB04 (0.25 μM). Control cells were treated with DMSO alone. Scale bar=50 μm d) Representative confocal images showing GFP labeled Lepto1, BT-474, and SK-BR3 cells in Matrigel invasion chambers. Whole well image from a 6 well plate is shown. Lepto1 cells were pre-treated with JIB04 (0.5 μM) for 24h and allowed to migrate into the bottom chamber containing astrocyte conditioned medium. JIB04 pre-treatment was sufficient to reduce the invasive potential of Lepto1 cells more than that of BT-474 and SK-BR-3 cell. e) Analysis of Annexin-V positivity in Lepto1, Lepto2, Lepto3, BT-474, and SK-BR-3 lines treated 48h with 0.5μM JIB04. Quantification of flow-cytometry data is shown. Means ± SD of 3 technical replicates and 3 biological replicates are shown. ** p<0.001 f) Quantification of the GFP signals of Lepto1, Lepto2, Lepto3, BT-474, and SK-BR-3 cells treated as shown in (d). Means ± SD of 3 technical replicates and 3 biological replicates are shown. *** p<0.001 g) Representative FACS plots showing Annexin-V levels in CD326+ Lepto1 cells incubated with JIB04 (0.25 μM) for 24, 48, and 72 h. h) Chemical structure of JIB04.
Figure 3.
Figure 3.. JIB04 treatment selectively targets the CSC phenotype and functionality of Lepto lines
a) Representative CD326/CD49f (top) and CD44/CD24 (bottom) FACS profiles of Lepto1 cells pre-treated with JIB04 (0.25 μM) and allowed to recover on subsequent Days 0–3. b) FACS-based quantification of live (DAPI-) CD326+CD49f- Lepto1 cells allowed to recover after 0.25μM JIB04 pre-treatment and then cultured without drug over days 0 to 3, as described in (a). Means ± SD of 3 biological replicates are shown. *** p<0.001. c) FACS based quantification of live, CD326+CD49f- Lepto1 cells to quantify the percent of CD44+CD24- Lepto1 cells, which were pre-treated with 0.25μM JIB04, and then cultured in the absence of compounds from day 0 to day 3. Means ± SD of 3 biological replicates are shown. *** p<0.001. d) Quantification of percent of tumorsphere initiating cells formed from CD326+CD49f- and CD44+CD24- Lepto cells treated as described in (b and c). Means ± SD of 3 technical replicates and 3 biological replicates are shown. * p<0.001. e) Assay for H3K9me3 demethylase activity in lysates of Lepto1 cells treated with 0.2μM JIB04 demonstrated loss of H3K9me3 demethylase activity in a dose-dependent fashion. Means ± SD of 3 technical replicates and 3 biological replicates are shown. *** p<0.001. f) Phase-contrast images of live (DAPI-negative) FACS-sorted CD326+CD49f- and CD44+CD24- Lepto1-GFP cells present in the bottom chamber of Matrigel invasion chambers after treatment with 0.1% DMSO (control) or JIB04 (0.02 or 0.04 μM) for 72 h. g) Simultaneous differential interference contrast (DIC) images (at 10X) of Lepto1 cells that had migrated to the bottom chamber of the matrigel invasion chamber on Day 4. Cell had been pre-treated with JIB04 (0.04 μM) for 72 h before being plated in the Matrigel invasion chambers. Scale bar=50 μm
Figure 4:
Figure 4:. JIB04 reduces HER2+ LC tumor growth in vivo, prolongs overall survival and decreases histone demethylase activity
a) Tumor-seeding ability of Lepto1, Lepto2 and Lepto3 cells pre-treated with DMSO or JIB04. Number of animals with significantly large Lepto derived tumors are counted per 8 Lepto injected animals. Comparison between DMSO vs JIB05 pre-treated Lepto bearing animal groups is *** p<0.001 b) Schematic illustrating implantation and evaluation of mCherry:LUC-expressing Lepto cells (100 K in 20 µL PBS) injected into the cisternae magna of NOD/SCID mice. Mice received intrathecal injections of DMSO or JIB04 (60 or 120 mg/kg, n=12 per group) on indicated days. Tumor growth was analyzed by BLI and survival by the Kaplan–Meyer method. c) Representative BLI images taken on days 16, 26, 40 and 60 after Lepto1 cell implantation, with or without JIB04 (60 or 120 mg/kg) treatment as per protocol shown in (4B). d) BLI-based quantification of tumor volume in mouse brain (red) and in the spinal cord (blue) on day 16 post Lepto1 implantation and in the presence or absence of JIB04 treatment, as indicated. Means ± SD n=4 (Vehicle treated controls), n=4 (60mg/Kg JIB04 treated) and n=4 (120mg/Kg JIB04 treated) mice are shown. *** p<0.001 e) BLI-based quantification of tumor volume in mouse brain (red) and in the spinal cord (blue) on day 26 post Lepto1 implantation and in the presence or absence of JIB04 treatment, as indicated. Means ± SD n=4 (Vehicle treated controls), n=4 (60mg/Kg JIB04 treated) and n=4 (120mg/Kg JIB04 treated) mice are shown. *** p<0.001 f)Western blot analysis of histone methylation in FACS-sorted CD326+ Lepto1 cells isolated from control (CTL; Day 30), methotrexate-treated (Met; Day 30) and JIB04-treated mice on Days 30, 40, and 50 post-implantations. Histone3 and H3K4me3 served as loading and internal controls. g) BLI based quantification of tumor volume from days 10 to 30 after Lepto1 cell implantation. Means of n=8 (Control treated), n=8 (60mg/Kg JIB04 treated) mice with standard deviations are shown. *** p<0.001 h) Kaplan–Meyer survival curves for each cohort treated as in g. *** p<0.01 i) Assay of H3K9me3 demethylase activity in tumor cells isolated from mice treated JIB04 demonstrates reduction of H3K9me3 demethylase activity. Means ± SD of 3 technical replicates and 3 biological replicates are shown. ** p<0.001.
Figure 5.
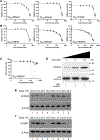
Figure 5.. JIB04 inhibits KDM demethylase activity in vitro
a) JIB04 dose response curves across Jumonji domain containing KDM demethylases, as measured by ELISA. Means ± SD of 3 technical replicates and 3 biological replicates are shown. IC50 values are given across various experiments; n=3 for KDM4A, KDM4B, KDM4C, b) JIB04 dose response curves across Jumonji domain containing KDM demethylases as measured by ELISA. Means ± SD of 3 technical replicates and 3 biological replicates are shown. IC50 values are given across various experiments; n=3 for KDM4E, KDM5A, and KDM6B c) JIB04 selectively inhibits Jumonji enzymes over other cellular hydroxylases in vitro. Mean of 3 for TET1 are shown, with standard deviations. d) Direct measure of histone demethylation by Western analysis (left panel, KDM4D) shows inhibition of Jumonji enzyme activity by JIB04. e) Cellular thermal shift assay demonstrates that KDM4A in Lepto1 cells are stabilized post JIB04 treatment. Representative immunoblots from CETSA experiments. f) Cellular thermal shift assay demonstrates that KDM4C in Lepto1 cells are stabilized post JIB04 treatment. Representative immunoblots from CETSA experiments.
Figure 6.
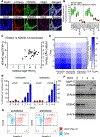
Figure 6.. Modulation of KDM demethylase family enzyme levels alters JIB04 effects in Lepto cells
a) IF analysis of serial spinal cord sections taken from mice 10 days after Lepto1 cell implantation. Imaging of OPCs (Olig2, purple), KDM4A or KDM4C (green), and mCherry (Lepto1 cells, red) indicates KDM4A (top) and KDM4C (bottom) overexpression in the Lepto1 cell layer relative to surrounding neuronal tissues. b) Quantification of KDM4A (left) and KDM4C (right) transcript levels as indicated by RT-qPCR. Color coding indicates relative levels of HER2. Means ± SD of 3 technical replicates and 3 biological replicates are shown. c) DepMap-based analysis of KDM4A/4C co-expression in metastatic breast cancer cell lines; listed in supplementary table 2 d) Heat map demonstrating fold-change in number of viable Lepto1 cells following DOX-induced shKDM4A, shKDM4C, or shGFP expression. Means ± SD of 3 technical replicates and 3 biological replicates are shown. KDM4A or 4C knockdown in Lepto1 cells significantly decreased the doubling time, relative to uninduced and shGFP control Lepto1 cells. e) FACS-based analyses of Annexin-V positivity in Lepto1 cells from days 0 to 6 after DOX treatment to induce shKDM4A (left) or shKDM4C (right) expression. Control cells were uninduced. Means ± SD of 3 biological replicates are shown. * represents p<0.001. f) Western blot analysis of KDM4A/4C protein levels 48 h after DOX (0–5 µg/mL) treatment to induce shKDM4A and shKDM4C in Lepto1 cells, as a means to confirm knockdown. g) Representative FACS plots of Annexin-V positivity in CD326+ Lepto1 cells with or without DOX-induced expression of shKDM4A (left) or shKDM4C (right).
Figure 7.
Figure 7.. KDM4A/4C regulates GM-CSF expression in HER2+ LC cells
a) Quantification of GM-CSF levels in conditioned media from Lepto1 cells cultured in media supplemented with hCSF, with or without JIB04. Data are based on Cytokine XL array blots shown in supplementary Figure 12E. Additional secreted factors are listed in Supplementary Table 3. b) (Top panel) Scheme showing lentiviral Tet-On 3G inducible GM-CSF expression cassette used in this study for conditional depletion of KDM4A/4C. (Bottom panel) Western blot analyses of KDM4A and 4C protein levels in Lepto1 cells expressing shKDM4A and/or shKDM4C following 2 and 5µg/mL DOX induction. c) ELISA-based quantification of GM-CSF in culture media of Lepto1 cells with or without shRNA-mediated depletion of KDM4A and/or KDM4C (n=3). Control cells were not treated with DOX. *** p<0.001 d) (Top row) Clonogenic proliferation of Lepto1 cells with or without DOX-mediated depletion of KDM4A and/or 4C. (Bottom row) Similar analyses of untransduced Lepto1 cells treated with DMSO (control) or 0.01–0.1μM JIB04. In both analyses, cells were stained with crystal violet. Means ± SD of 3 technical replicates and 3 biological replicates are shown. Image of whole well from a 6 well plate is shown. e) Quantification of colonies depicted in (d). Means ± SD of 3 technical replicates and 3 biological replicates are shown. *** p<0.001 f) Quantification of activity of a GM-CSF luciferase reporter in primary Lepto1 cells with or without DOX-mediated depletion of KDM4A/4C or treated with DMSO or JIB04. Means ± SD of 3 technical replicates and 3 biological replicates are shown. *** p<0.001

References

    1. Nayar G, Ejikeme T, Chongsathidkiet P, Elsamadicy AA, Blackwell KL, Clarke JM, et al. Leptomeningeal disease: current diagnostic and therapeutic strategies. Oncotarget 2017;8:73312–28 - PMC - PubMed
    1. Brown DA, Lu VM, Himes BT, Burns TC, Quinones-Hinojosa A, Chaichana KL, et al. Breast brain metastases are associated with increased risk of leptomeningeal disease after stereotactic radiosurgery: a systematic review and meta-analysis. Clin Exp Metastasis 2020;37:341–52 - PubMed
    1. Kim DW, Barcena E, Mehta UN, Rohlfs ML, Kumar AJ, Penas-Prado M, et al. Prolonged survival of a patient with metastatic leptomeningeal melanoma treated with BRAF inhibition-based therapy: a case report. BMC Cancer 2015;15:400– - PMC - PubMed
    1. DeAngelis LM. Current diagnosis and treatment of leptomeningeal metastasis. J Neurooncol 1998;38:245–52 - PubMed
    1. DeAngelis LM, Boutros D. Leptomeningeal metastasis. Cancer Invest 2005;23:145–54 - PubMed

Publication types

MeSH terms