

Viral genomes reveal patterns of the SARS-CoV-2 outbreak in Washington State
- PMID: 33941621
- PMCID: PMC8158963
- DOI: 10.1126/scitranslmed.abf0202
Viral genomes reveal patterns of the SARS-CoV-2 outbreak in Washington State
Abstract
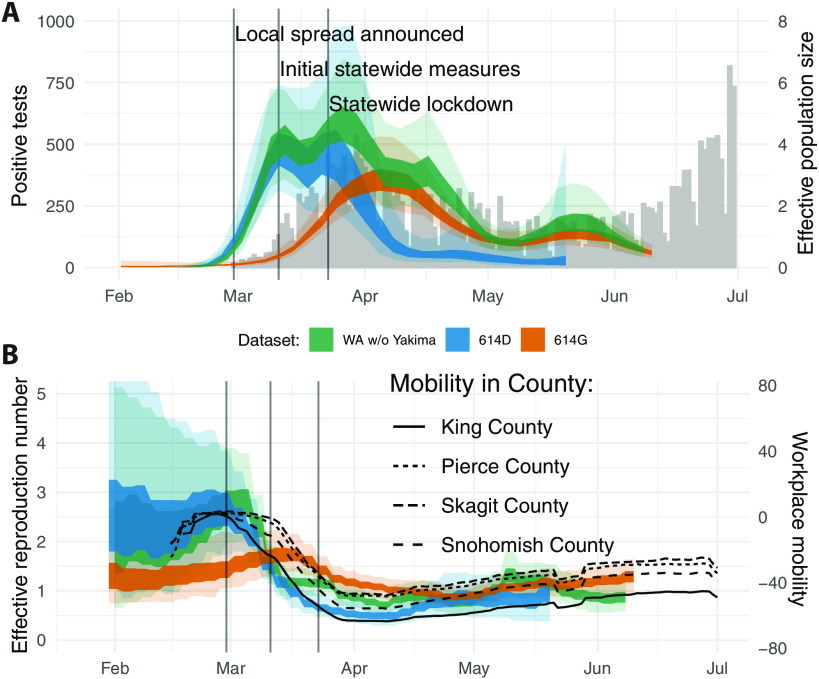
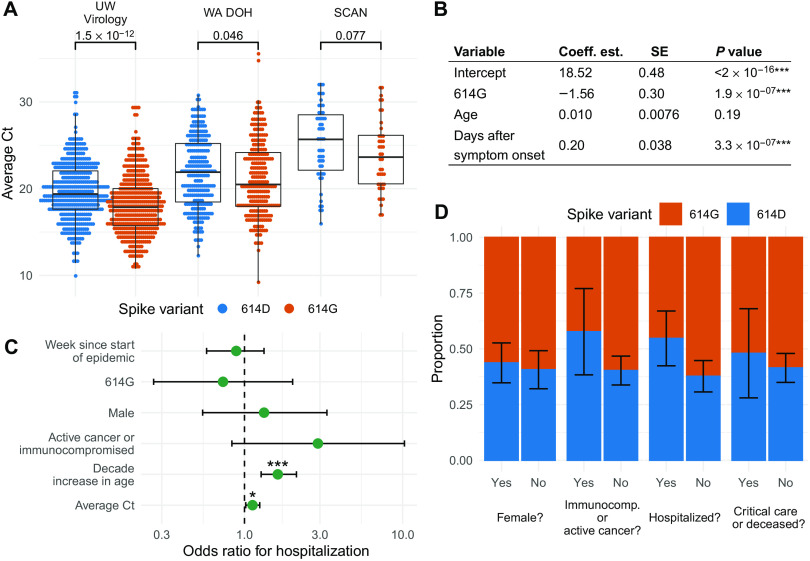
The rapid spread of severe acute respiratory syndrome coronavirus 2 (SARS-CoV-2) has gravely affected societies around the world. Outbreaks in different parts of the globe have been shaped by repeated introductions of new viral lineages and subsequent local transmission of those lineages. Here, we sequenced 3940 SARS-CoV-2 viral genomes from Washington State (USA) to characterize how the spread of SARS-CoV-2 in Washington State in early 2020 was shaped by differences in timing of mitigation strategies across counties and by repeated introductions of viral lineages into the state. In addition, we show that the increase in frequency of a potentially more transmissible viral variant (614G) over time can potentially be explained by regional mobility differences and multiple introductions of 614G but not the other variant (614D) into the state. At an individual level, we observed evidence of higher viral loads in patients infected with the 614G variant. However, using clinical records data, we did not find any evidence that the 614G variant affects clinical severity or patient outcomes. Overall, this suggests that with regard to D614G, the behavior of individuals has been more important in shaping the course of the pandemic in Washington State than this variant of the virus.
Copyright © 2021 The Authors, some rights reserved; exclusive licensee American Association for the Advancement of Science. No claim to original U.S. Government Works. Distributed under a Creative Commons Attribution License 4.0 (CC BY).
Figures


Update of
-
Viral genomes reveal patterns of the SARS-CoV-2 outbreak in Washington State.medRxiv [Preprint]. 2020 Sep 30:2020.09.30.20204230. doi: 10.1101/2020.09.30.20204230. medRxiv. 2020. Update in: Sci Transl Med. 2021 May 26;13(595):eabf0202. doi: 10.1126/scitranslmed.abf0202. PMID: 33024981 Free PMC article. Updated. Preprint.
References
-
- A. Rambaut, Phylogenetic analysis of nCoV-2019 genomes. Virological (available at http://virological.org/t/phylodynamic-analysis-176-genomes-6-mar-2020/356).
-
- Bedford T., Greninger A. L., Roychoudhury P., Starita L. M., Famulare M., Huang M.-L., Nalla A., Pepper G., Reinhardt A., Xie H., Shrestha L., Nguyen T. N., Adler A., Brandstetter E., Cho S., Giroux D., Han P. D., Fay K., Frazar C. D., Ilcisin M., Lacombe K., Lee J., Kiavand A., Richardson M., Sibley T. R., Truong M., Wolf C. R., Nickerson D. A., Rieder M. J., Englund J. A., Hadfield J., Hodcroft E. B., Huddleston J., Moncla L. H., Müller N. F., Neher R. A., Deng X., Gu W., Federman S., Chiu C., Duchin J., Gautom R., Melly G., Hiatt B., Dykema P., Lindquist S., Queen K., Tao Y., Uehara A., Tong S., MacCannell D., Armstrong G. L., Baird G. S., Chu H. Y., Shendure J., Jerome K. R., Cryptic transmission of SARS-CoV-2 in Washington State. Science 370, 571–575 (2020). - PMC - PubMed
-
- Korber B., Fischer W. M., Gnanakaran S., Yoon H., Theiler J., Abfalterer W., Hengartner N., Giorgi E. E., Bhattacharya T., Foley B., Hastie K. M., Parker M. D., Partridge D. G., Evans C. M., Freeman T. M., de Silva T. I., McDanal C., Perez L. G., Tang H., Moon-Walker A., Whelan S. P., LaBranche C. C., Saphire E. O., Montefiori D. C., Angyal A., Brown R. L., Carrilero L., Green L. R., Groves D. C., Johnson K. J., Keeley A. J., Lindsey B. B., Parsons P. J., Raza M., Rowland-Jones S., Smith N., Tucker R. M., Wang D., Wyles M. D., Tracking changes in SARS-CoV-2 Spike: Evidence that D614G increases infectivity of the COVID-19 virus. Cell 182, 812–827.e19 (2020). - PMC - PubMed
-
- Yurkovetskiy L., Pascal K. E., Tompkins-Tinch C., Nyalile T., Wang Y., Baum A., Diehl W. E., Dauphin A., Carbone C., Veinotte K., Egri S. B., Schaffner S. F., Lemieux J. E., Munro J., Sabeti P. C., Kyratsous C., Shen K., Luban J., SARS-CoV-2 spike protein variant D614G increases infectivity and retains sensitivity to antibodies that target the receptor binding domain.bioRxiv, 2020.07.04.187757 (2020).
Publication types
MeSH terms
Grants and funding
LinkOut - more resources
Full Text Sources
Other Literature Sources
Medical
Miscellaneous
