. 2021 Jun 2;13(596):eabf8396.
doi: 10.1126/scitranslmed.abf8396. Epub 2021 May 3.

COVID-19-related anosmia is associated with viral persistence and inflammation in human olfactory epithelium and brain infection in hamsters

Affiliations

COVID-19-related anosmia is associated with viral persistence and inflammation in human olfactory epithelium and brain infection in hamsters

Guilherme Dias de Melo et al. Sci Transl Med. .

Abstract

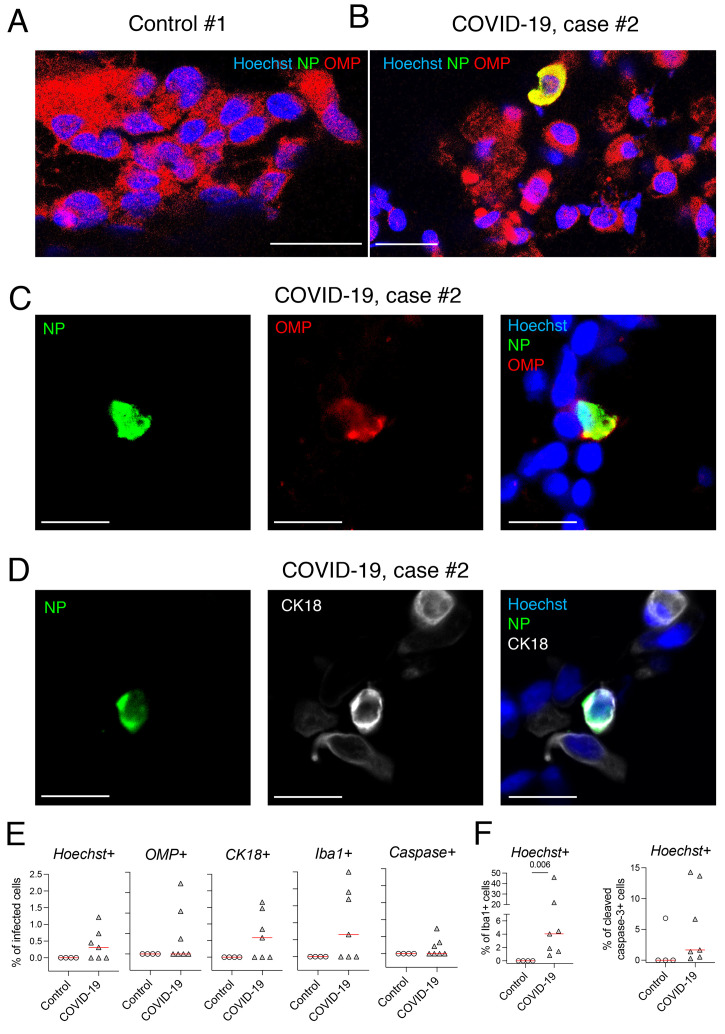
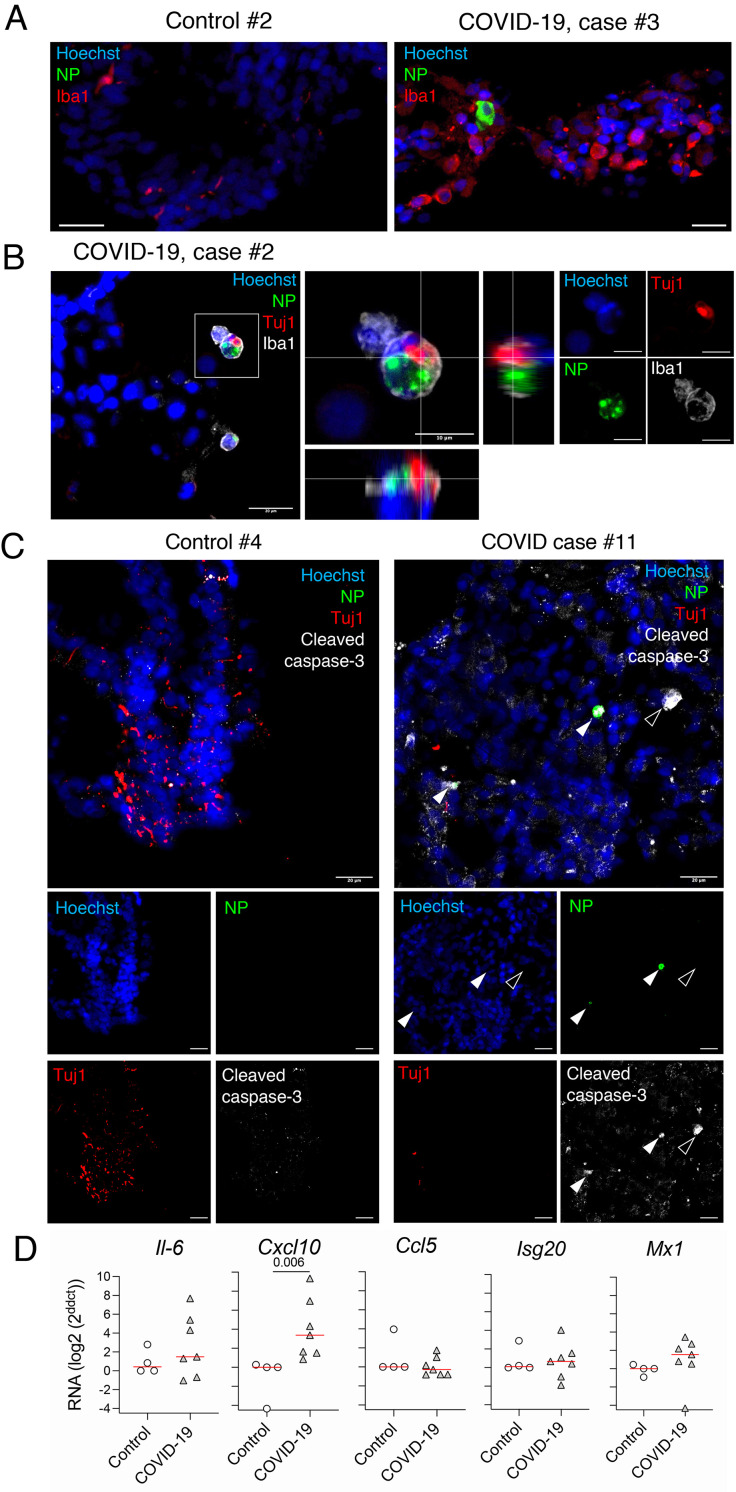
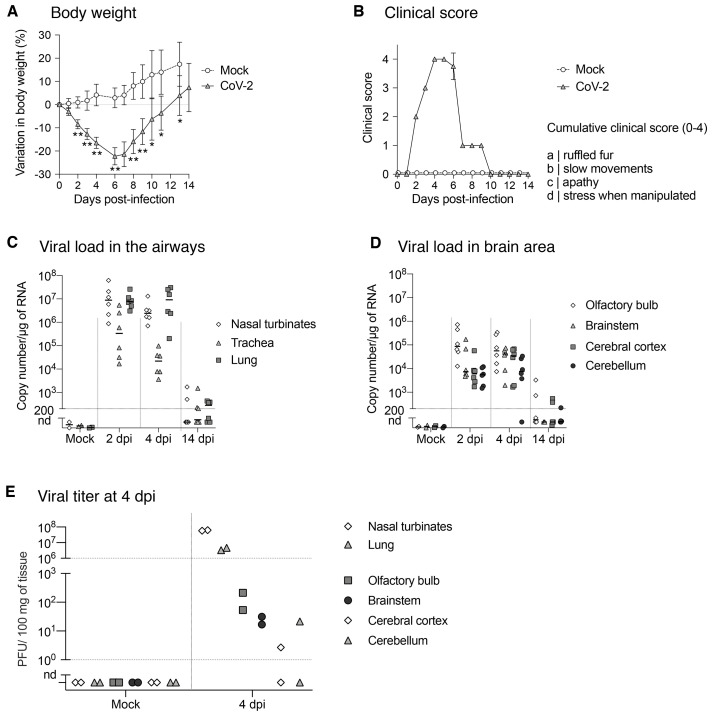
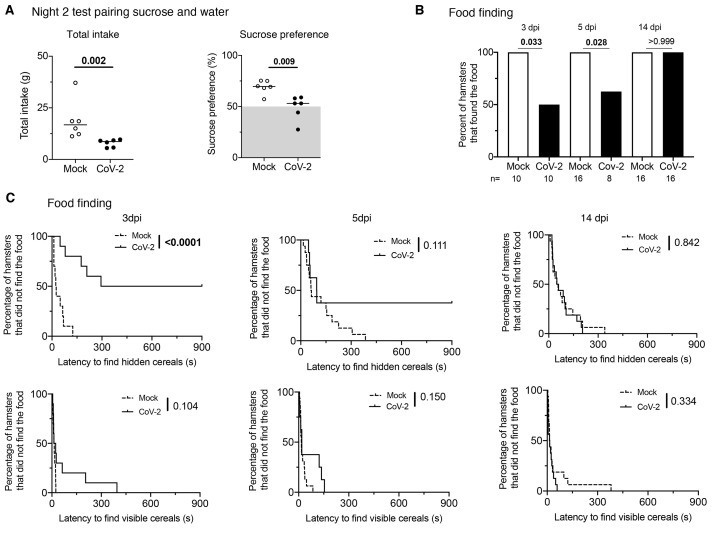
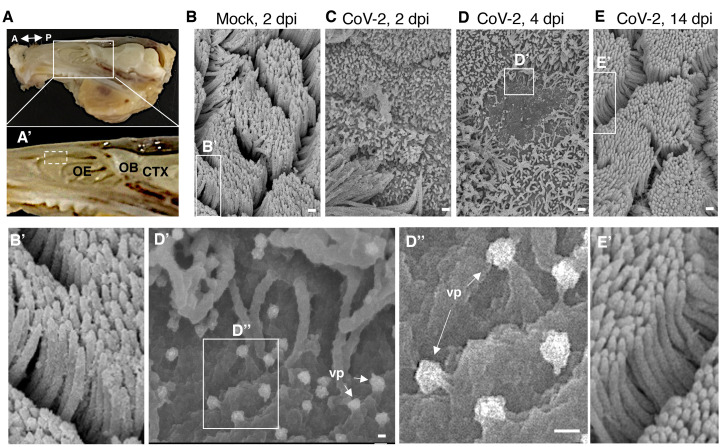
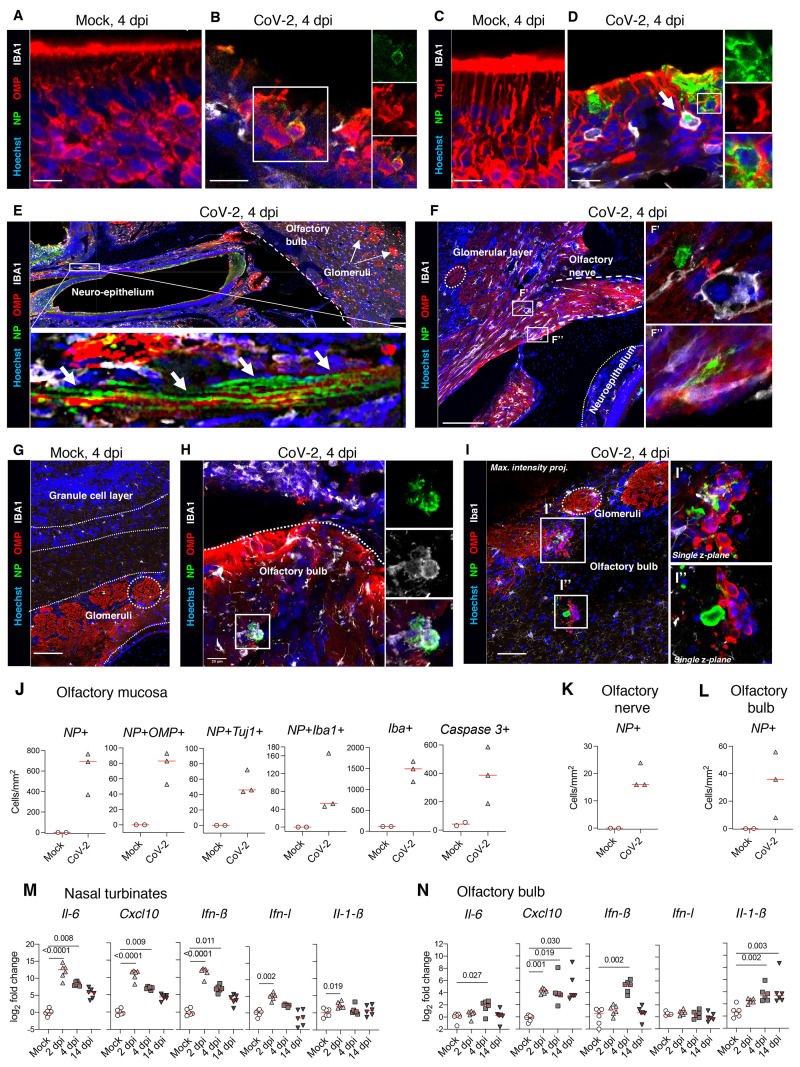
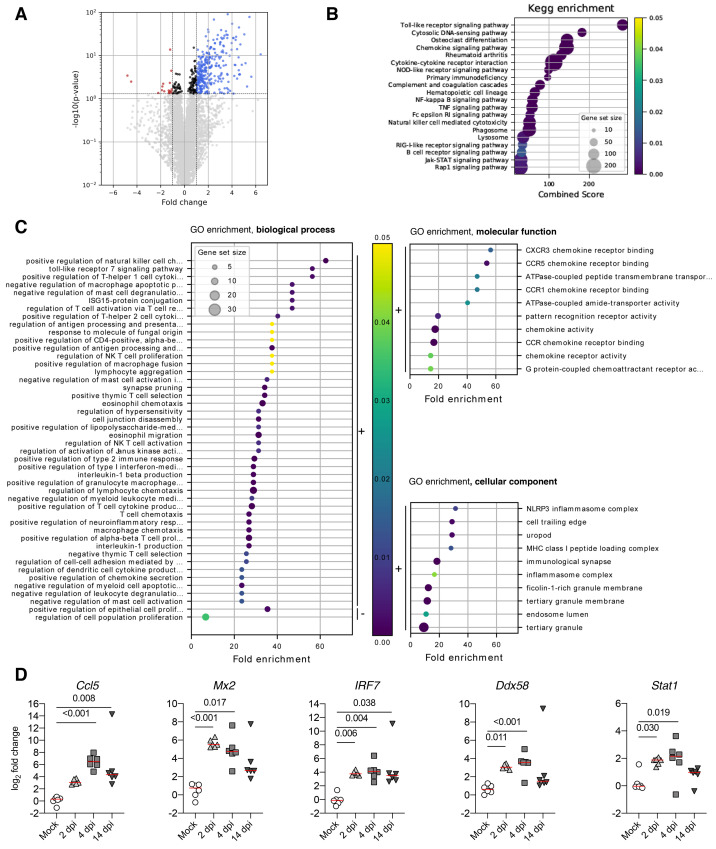
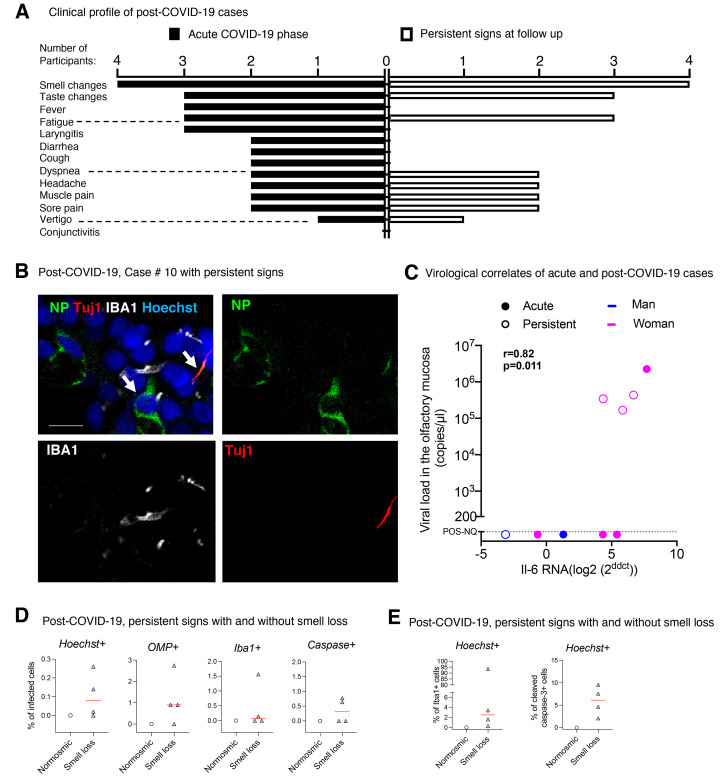
Whereas recent investigations have revealed viral, inflammatory, and vascular factors involved in severe acute respiratory syndrome coronavirus 2 (SARS-CoV-2) lung pathogenesis, the pathophysiology of neurological disorders in coronavirus disease 2019 (COVID-19) remains poorly understood. Olfactory and taste dysfunction are common in COVID-19, especially in mildly symptomatic patients. Here, we conducted a virologic, molecular, and cellular study of the olfactory neuroepithelium of seven patients with COVID-19 presenting with acute loss of smell. We report evidence that the olfactory neuroepithelium is a major site of SARS-CoV2 infection with multiple cell types, including olfactory sensory neurons, support cells, and immune cells, becoming infected. SARS-CoV-2 replication in the olfactory neuroepithelium was associated with local inflammation. Furthermore, we showed that SARS-CoV-2 induced acute anosmia and ageusia in golden Syrian hamsters, lasting as long as the virus remained in the olfactory epithelium and the olfactory bulb. Last, olfactory mucosa sampling from patients showing long-term persistence of COVID-19-associated anosmia revealed the presence of virus transcripts and of SARS-CoV-2-infected cells, together with protracted inflammation. SARS-CoV-2 persistence and associated inflammation in the olfactory neuroepithelium may account for prolonged or relapsing symptoms of COVID-19, such as loss of smell, which should be considered for optimal medical management of this disease.


Figures

Fig. 1
Fig. 1
Analysis of olfactory mucosa from patients with COVID-19 with acute olfactory function loss, at early stage of infection. (A) Immunofluorescence of cells retrieved from the olfactory mucosa of the control subject #1. (B) Cells retrieved from the olfactory mucosa of the COVID-19 patient #2. (C, D) Close-up immunofluorescence images of olfactory epithelium samples from COVID-19 patient #2. Infected mature olfactory neurons (OMP+) are observed (B, C), alongside sustentacular CK18+ cells (D). (E) Percent of infected NP+ cells among: Hoechst+ cells, OMP+ cells, CK18+ cells, Iba1+ cells and cleaved caspase 3+ cells. (F) Percent of Iba1+ cells among Hoechst+ cells (left), and percent of cleaved caspase 3 + cells among Hoechst+ cells (right). SARS-CoV-2 is detected by antibodies raised against the viral nucleoprotein (NP). N=4 controls, N=7 patients with COVID-19 (E, F); Horizontal red lines indicate the medians. Mann-Whitney test (E, F); The p value is indicated when significant. Scale bars = 20μm (A, B) or 10μm (C, D).
Fig. 2
Fig. 2
Immune response in olfactory mucosa of patients with COVID-19 with acute olfactory function loss. (A) Immunofluorescence of myeloid cells (Iba1+) retrieved from the olfactory mucosa of the control subject #2 vs COVID-19 case #3. (B) Orthogonal projection of Tuj1+ antigens included in infected Iba1+ cell. (C) Immunofluorescence of apoptotic cells (cleaved caspase-3+) of control #4 and COVID-19 case#11. Solid arrows: infected cells positive for cleaved caspase-3. Empty arrow: non-infected cell positive for cleaved caspase-3. (D) Cytokines and chemokines transcripts in the olfactory mucosa. N=4 controls, N=7 patients with COVID-19. Horizontal red lines indicate the medians. Mann-Whitney test (D). The p value is indicated when significant. Scale bars = 20μm or 10μm (B, inset).
Fig. 3
Fig. 3. Clinical and molecular characteristics of experimental infection with SARS-CoV-2 in golden hamsters.
(A-B) Variation in body weight (A) and clinical score (B) of mock- and SARS-CoV-2 infected hamsters for 14 days post-infection (dpi). (C, D) Quantification of SARS-CoV-2 RNA in hamster airways (C) and in different brain areas (D) of mock and infected-animals at 2, 4 and 14 dpi. (E) Infectious viral titer in the nasal turbinates, lung, olfactory bulb, brainstem, cerebral cortex and cerebellum at 4 dpi expressed as Plaque Forming Units (PFU)/100 mg of tissue. Horizontal lines indicate medians. N=4-8/ timepoint in (A, B); N=6/timepoint in (C, D); N=2/timepoint in (E). Mann-Whitney test comparing infected animals to mock (A). *p<0.05; **p<0.01.
Fig. 4
Fig. 4
Experimental infection with SARS-CoV-2 in golden hamster induces transient anosmia and ageusia. (A) Variation in total consumption of liquid overnight and preference toward 2% sucrose-containing water of control and SARS-CoV-2 infected hamsters at 2 dpi. (B) Fraction of control or infected hamsters successfully finding hidden food in 15 min. (C) Fraction of control or infected hamsters successfully finding hidden or visible food over time. Food-finding assays were performed at 3, 5- and 14-dpi. Mann-Whitney test (A), Fisher’s exact test (B) and Log-rank (Matel-Cox) test (C). P value is indicated in bold when significant. Bars indicate medians. N=6-per group in (A); N=10 mock and N=10 CoV-2 at 3 dpi, N=16 mock and N=8 CoV-2 at 5 dpi, N=16 per group at 14 dpi in (B, C).
Fig. 5
Fig. 5
SARS-CoV-2 induces loss of ciliation in the olfactory epithelium. (A) Dissected hamster head, skin and lower jaw removed, sagitally cut in half. Double-headed arrow denotes the antero-posterior (A-P) axis. Close-up in A’ shows the close relationship between the olfactory epithelium (OE), the olfactory bulb (OB) and the cerebral cortex (CTX). Discontinuous square indicates the area collected for scanning electron microscopy. (B-E) Scanning electron microscope imaging showing changes in olfactory epithelium following SARS-CoV-2 infection. The olfactory epithelium of mock- (B, B’) and CoV-2 inoculated hamsters at 2 dpi (C), 4 dpi (D, D’, D”) and 14 dpi (E, E’). A loss of cilia is observed at 2 and 4 dpi for infected hamsters. Viral particles (vp) are seen emerging from deciliated cells (D’-D’’, white arrows). Scale bars: 1 μm (B-E), 100 nm (D’, D”).
Fig. 6
Fig. 6. SARS-CoV-2 antigens detection and cytokine/chemokine transcripts quantification in the olfactory system of hamsters.
(A-D) Olfactory epithelium of mock- (A, C) and SARS-CoV-2 (B, D) infected hamsters at 4 dpi. Insets show infected OMP+ mature olfactory sensory neurons (B), or infected Tuj1+ immature olfactory sensory neurons (D). The arrow in D indicates an infected Iba1+ cell. (E) Sagittal section showing nasal turbinates and olfactory bulb of SARS-CoV-2 infected hamster at 4 dpi. Inset depicts SARS-CoV-2 staining in olfactory sensory neuron axons. (F) Olfactory sensory axons projecting into glomeruli in the olfactory bulb of SARS-CoV-2 inoculated hamsters at 4 dpi. Insets (F’, F’’) show infected cells. (G-I) Olfactory bulb of mock-(G) or SARS-CoV-2 (H, I) infected hamsters at 4 dpi. Iba1+ infected cells are shown in (H) and several infected cells are observed in (I). SARS-CoV-2 is detected by antibodies raised against the viral nucleoprotein (NP). Scale bars: 20μm (A-D, H), 100μm (E, F), 50μm (G, I). Images are single z-planes (A-H) or maximum intensity projection over a 6μm depth (I). (J) Number of NP+ cells, NP+OMP+ cells, NP+Tuj1+ cells, NP+Iba1+, Iba1+ cells and cleaved caspase 3+ cells in the olfactory mucosa. (K, L) Number of NP+ cells in the olfactory nerve (K) and the olfactory bulb (L). (M, N) Cytokines and chemokines transcripts in the nasal turbinates (M) and in the olfactory bulb (N) at 2, 4 and 14 dpi. Mann-Whitney test (E, F). Kruskal-Wallis followed by the Dunn’s multiple comparison test (M, N). The p value is indicated when significant. Horizontal red lines indicate the medians.
Fig. 7
Fig. 7. Differentially expressed genes in the olfactory bulb of golden hamsters infected by SARS-CoV-2 (at 4 dpi) derived by RNA-seq.
(A). Volcano plot of the comparisons between infected and non-infected samples. Y-axis represents the Benjamini-Hochberg corrected p-value on a logarithmic scale (-log10). Grey dots represent genes not passing a threshold of FDR < 0.05. Black dots represent genes passing the FDR threshold but having fold changes between -1 and 1. Red and blue dots correspond to significant down and up-regulated genes with a fold change inferior to -1 or superior to 1, respectively. (B). KEGG-pathways enrichment based on the differentially regulated genes between infected and non-infected samples. Only the 20 highest combined scores are plotted. Circle sizes are proportional to the gene set size. Circle color is proportional to the corrected p-values and corresponds to the scale presented in C, D and E. (C). GO enrichment analysis considering biological process only. Selected GO terms are based on the up and down-regulated genes between infected and non-infected samples. The black bars on the right-hand side of the scatter plot indicate enrichment based on down (“-”) and up (“+”) regulated gene sets. Only the 50 highest fold enrichments are plotted for the up regulated gene set. Circle sizes are proportional to the gene set size, which shows the total size of the gene set associated with GO terms. Circle color is proportional to the corrected p-values and corresponds to the scale presented between C, D and E. GO enrichment analysis considering molecular function and cellular components related Figures follow the same construction as in biological process, with the exception that only the 10 highest fold enrichments are plotted for the up regulated gene set. (D) Validation targets in the olfactory bulb at 2, 4 and 14 dpi. n=6/time-point. Kruskal-Wallis followed by the Dunn’s multiple comparison test (J, K). The p value is indicated when significant. Horizontal lines indicate the medians. Complete analysis is listed in Supplementary Data file S2
Fig. 8
Fig. 8
SARS-CoV-2 is present in the olfactory mucosa from patients with persistent loss of smell post-COVID-19. (A) Clinical profile of the 4 patients with prolonged loss of smell post-COVID-19. The general symptoms at the acute phase and at the follow up (inclusion in CovidSmell study) are shown. (B) Immunofluorescence of infected cells in the olfactory mucosa of the case #10 presenting with persistent olfactory dysfunction at 196 days after COVID-19 onset. The left arrow indicates an infected cell with viral NP staining. The right arrow indicates a Tuj1-NP co-labeling in another cell. (C) Graph depicting the correlation between the IL-6 mRNA expression and the viral load in the 9 patients with acute COVID-19 (“acute”: n=5) or persistent olfactory dysfunction post-COVID-19 (“persistent”, n=4). (D, E) Fraction of infected cells among: Hoechst+ cells, OMP+ cells, Iba1+ cells and cleaved caspase 3+ cells (D), and fraction of Iba1+ cells among Hoechst+ cells (left), and fraction of cleaved caspase 3 + cells among Hoechst+ cells (right) in the olfactory mucosa of patients with persistent loss of smell post COVID-19 (n=4) and the patient #7 (post-COVID-19, persistent signs without loss of smell). (E) Viral load values were assessed by Taqman qPCR; when not quantifiable (nq: <200 copies /μL), they were arbitrary given the 50 value for Spearman test (C). Variations in the cytokine gene expression were calculated as the n-fold change in expression in the swabs compared with the swab value of control #1 that was arbitrary put on zero value. Horizontal red lines indicate the medians (D, E). Mann-Whitney test D, E), Spearman test (C). Scale bar: 10 μm.

Similar articles

Cited by

References

    1. WHO, WHO Coronavirus Disease (COVID-19) Dashboard. https://covid19.who.int/ (2020).
    1. Helms J., Kremer S., Merdji H., Clere-Jehl R., Schenck M., Kummerlen C., Collange O., Boulay C., Fafi-Kremer S., Ohana M., Anheim M., Meziani F., Neurologic Features in Severe SARS-CoV-2 Infection. N. Engl. J. Med. 382, 2268–2270 (2020). 10.1056/NEJMc2008597 - DOI - PMC - PubMed
    1. Qiu C., Cui C., Hautefort C., Haehner A., Zhao J., Yao Q., Zeng H., Nisenbaum E. J., Liu L., Zhao Y., Zhang D., Levine C. G., Cejas I., Dai Q., Zeng M., Herman P., Jourdaine C., de With K., Draf J., Chen B., Jayaweera D. T., Denneny J. C. 3rd, Casiano R., Yu H., Eshraghi A. A., Hummel T., Liu X., Shu Y., Lu H., Olfactory and Gustatory Dysfunction as an Early Identifier of COVID-19 in Adults and Children: An International Multicenter Study. Otolaryngol. Head Neck Surg. 163, 714–721 (2020). 10.1177/0194599820934376 - DOI - PMC - PubMed
    1. Xydakis M. S., Dehgani-Mobaraki P., Holbrook E. H., Geisthoff U. W., Bauer C., Hautefort C., Herman P., Manley G. T., Lyon D. M., Hopkins C., Smell and taste dysfunction in patients with COVID-19. Lancet Infect. Dis. 20, 1015–1016 (2020). 10.1016/S1473-3099(20)30293-0 - DOI - PMC - PubMed
    1. Cantuti-Castelvetri L., Ojha R., Pedro L. D., Djannatian M., Franz J., Kuivanen S., van der Meer F., Kallio K., Kaya T., Anastasina M., Smura T., Levanov L., Szirovicza L., Tobi A., Kallio-Kokko H., Österlund P., Joensuu M., Meunier F. A., Butcher S. J., Winkler M. S., Mollenhauer B., Helenius A., Gokce O., Teesalu T., Hepojoki J., Vapalahti O., Stadelmann C., Balistreri G., Simons M., Neuropilin-1 facilitates SARS-CoV-2 cell entry and infectivity. Science 370, 856–860 (2020). - PMC - PubMed

Publication types