. 2021 May 11;118(19):e2014866118.
doi: 10.1073/pnas.2014866118.

Protein structure-based gene expression signatures

Affiliations

Protein structure-based gene expression signatures

Rayees Rahman et al. Proc Natl Acad Sci U S A. .

Abstract

Gene expression signatures (GES) connect phenotypes to differential messenger RNA (mRNA) expression of genes, providing a powerful approach to define cellular identity, function, and the effects of perturbations. The use of GES has suffered from vague assessment criteria and limited reproducibility. Because the structure of proteins defines the functional capability of genes, we hypothesized that enrichment of structural features could be a generalizable representation of gene sets. We derive structural gene expression signatures (sGES) using features from multiple levels of protein structure (e.g., domain and fold) encoded by the mRNAs in GES. Comprehensive analyses of data from the Genotype-Tissue Expression Project (GTEx), the all RNA-seq and ChIP-seq sample and signature search (ARCHS4) database, and mRNA expression of drug effects on cardiomyocytes show that sGES are useful for characterizing biological phenomena. sGES enable phenotypic characterization across experimental platforms, facilitates interoperability of expression datasets, and describe drug action on cells.

Keywords: gene expression signatures; reproducibility; structural bioinformatics.


Conflict of interest statement

Competing interest statement: R.R. and A.S. are co-founders of Aichemy Inc.

Figures

Fig. 1.
Fig. 1.
Protein structure enrichment clusters tissue-specific gene expression. (A) Structural Classification of Proteins—extended (SCOPe) hierarchy of protein structural features, with examples. (B) Workflow to generate sGES. (C) The top 250 highest-expressed genes from GTEx (in terms of transcripts per million) were obtained. Tissue samples were clustered based on the presence or absence of the GES using t-SNE. sGES were then derived from the GES, and tissue samples were clustered by using t-SNE based on the presence or absence of structural features at the domain and fold levels. Each sample is colored by tissue type.
Fig. 2.
Fig. 2.
Metrics to evaluate GES consistency, predictivity, and robustness. (A) Evaluation metrics for GES consistency, predictivity, and robustness. (B) Approach of measuring consistency, robustness, and outlier detection. (C) Workflow for evaluating the reproducibility of GES, structural signatures, and integrated signatures from GTEx and ARCHS4.
Fig. 3.
Fig. 3.
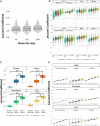
Signature consistency improves using protein structure. (A) Pairwise GES JC distributions across randomly selected, distinct tissues types. The average pairwise, inconsistent GES JC was determined to be 0.33 across gene set sizes of 50, 250, and 1,000 genes in a GES. (B) Distributions of JC values within tissue types. For each pairs of samples, in each tissue type (as cataloged by GTEx), a JC was computed for the top 250 highly expressed genes (by transcripts per million [TPM]) and their derivative sGES at each structural level. All distributions are statistically significant from each other using pairwise t tests, with false discovery rate (FDR) correction (SI Appendix, Table S2). The red line indicates a JC of 0.33. (C) Distributions of structures are randomly assigned to each gene. “Across Tissues” are JC distributions between unlike tissue types. “Within Tissues” are the JC distributions between the same tissue type. Red line indicates a JC of 0.33, ***P < 0.001 from a two-sided t test between each comparison. (D) Evaluation of sGES on mSigDB, The Human Protein Atlas, and TISSUES 2.0 methods of generating robust, tissue-specific GES. Pairwise JC were generated between tissue-specific signatures from mSigDB and the Human Protein Atlas to the highest expressed genes from GTEx database.
Fig. 4.
Fig. 4.
Predictivity of GES and sGES within the GTEx database. A random forest was trained using GES (of size 250) and sGES at different structural levels (Domain, Family, Superfamily, and Fold) for GTEx tissue expression data. ROC curves are displayed for each structural level.
Fig. 5.
Fig. 5.
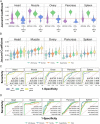
Robustness of GTEx GES using the ARCHS4 database. (A) Distributions of JC values for a gene signature size of 250 for tissues within the ARCHS4 (purple), the GTEx (green), and across the ARCHS4 and GTEx (blue) databases. Red line indicates a JC = 0.33. (B) Overlap of GTEx sGES with ARCHS4 signatures, across all structure levels. Red line indicates a JC = 0.33. (C) Predictive performance of a random forest model on GTEx gene sets of size 50, 250, and 1,000 highly expressed genes for predicting tissues from the ARCHS4 database after 10-fold cross validation. (D) Performance of a random forest classifier to predict ARCHS4 tissue type trained on GTEx top 250 GES or derived sGES.
Fig. 6.
Fig. 6.
Integrated signatures enable identification of robust signatures across databases. (A) Detection of outlier samples compared to GTEx gene signatures using a stacked denoising autoencoder trained to reconstruct gene signature membership from GTEx (green) gene signatures (of size 250 genes). Samples with high reconstruction error indicate that the sample is an outlier when compared to GTEx gene signatures. The red line indicates error values 2 SDs away from the mean of the distribution of errors reconstructing a validation GTEx set (error of 0.00725). (B) Outlier detection using distinct structural signature levels for muscle tissue. (C) GES and sGES autoencoders were combined by averaging the reconstruction error for each sample. Using this approach, we are able to identify the true outlier sample in ARCHS4, as compared to GTEx healthy tissue. (D) Predictive performance of GTEx GES to predict ARCHS4 tissue types, before and after outliers from ARCHS4 were removed. (E) Consistency of GES and sGES of across ARCHS4 and GTEx for muscle and whole-blood tissue types, before outlier removal (black) and after outlier removal (turquoise). Red line indicates a JC = 0.33.
Fig. 7.
Fig. 7.
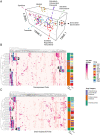
Characterization of kinase inhibitor activity using structural signatures. (A) t-SNE clustering of fold signatures from distinct type of drugs on Promocell cardiomyocyte–like cell lines. Rows are labeled by drug name or level 3 anatomical therapeutic chemical (ATC) category. (B) Overexpressed fold signatures for certain drugs. Distinct overexpressed clusters of folds are identified with numbers 1–5 and are described in SI Appendix, Table S8. (C) Underexpressed fold signatures for certain drugs. Distinct underexpressed clusters of folds are identified with numbers 1–4 and are described in SI Appendix, Table S9.

References

    1. Gundersen G. W., et al. ., GEN3VA: Aggregation and analysis of gene expression signatures from related studies. BMC Bioinformatics 17, 461 (2016). - PMC - PubMed
    1. Li M., et al. ., HiFreSP: A novel high-frequency sub-pathway mining approach to identify robust prognostic gene signatures. Brief. Bioinform. 21, 1411–1424 (2020). - PubMed
    1. Shafi A., Nguyen T., Peyvandipour A., Draghici S., GSMA: An approach to identify robust global and test gene signatures using meta-analysis. Bioinformatics 36, 487–495 (2020). - PMC - PubMed
    1. Ashburner M.et al. .; The Gene Ontology Consortium , Gene ontology: Tool for the unification of biology. Nat. Genet. 25, 25–29 (2000). - PMC - PubMed
    1. The Gene Ontology Consortium , The gene ontology resource: 20 years and still GOing strong. Nucleic Acids Res. 47, D330–D338 (2019). - PMC - PubMed

Publication types

LinkOut - more resources