. 2021 May 11;118(19):e2025556118.
doi: 10.1073/pnas.2025556118.

The voltage sensor is responsible for ΔpH dependence in Hv1 channels

Affiliations

The voltage sensor is responsible for ΔpH dependence in Hv1 channels

Emerson M Carmona et al. Proc Natl Acad Sci U S A. .

Abstract

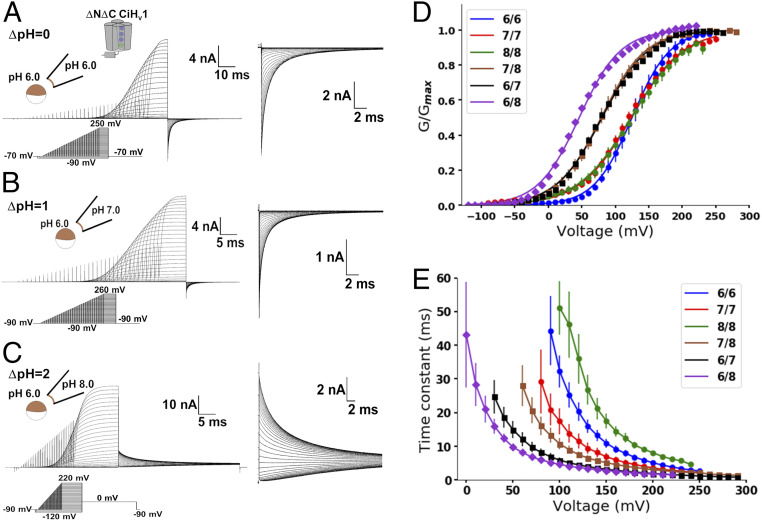
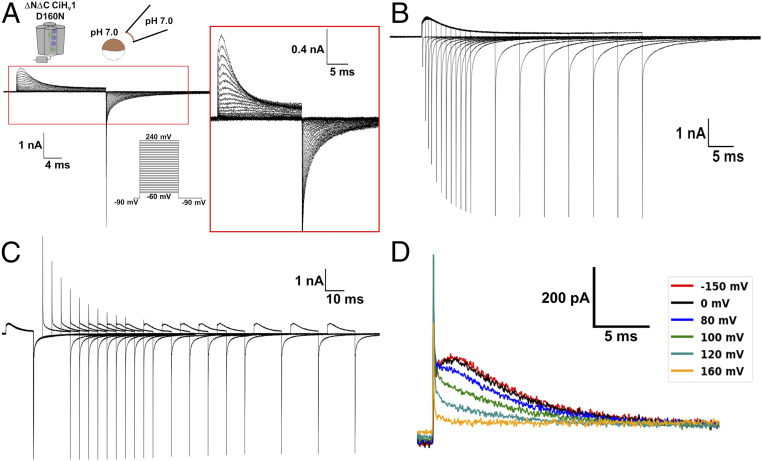
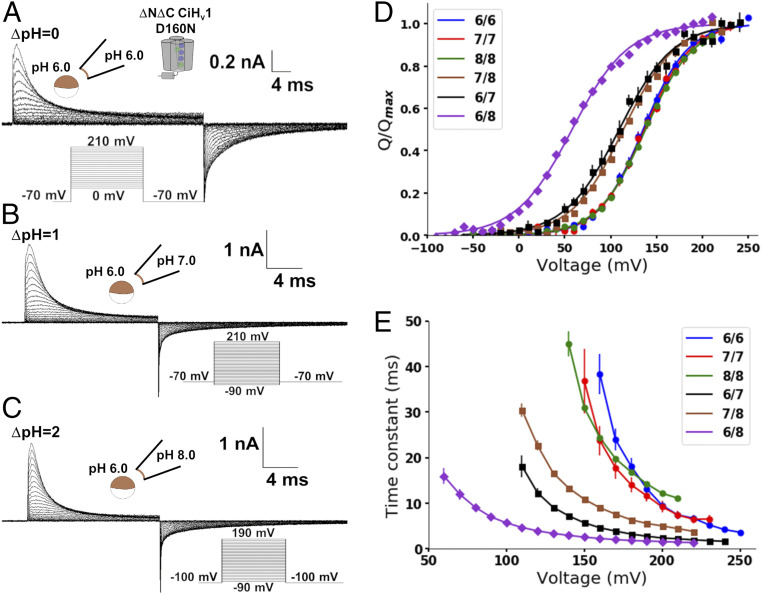
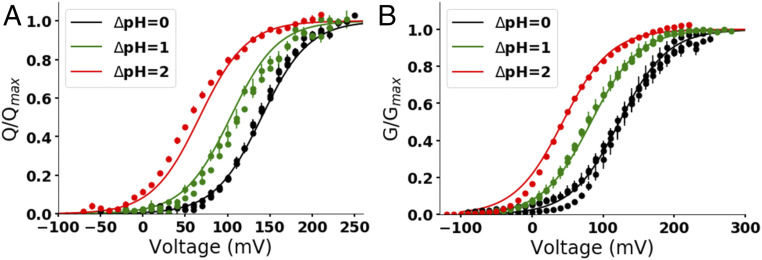
The dissipation of acute acid loads by the voltage-gated proton channel (Hv1) relies on regulating the channel's open probability by the voltage and the ΔpH across the membrane (ΔpH = pHex - pHin). Using monomeric Ciona-Hv1, we asked whether ΔpH-dependent gating is produced during the voltage sensor activation or permeation pathway opening. A leftward shift of the conductance-voltage (G-V) curve was produced at higher ΔpH values in the monomeric channel. Next, we measured the voltage sensor pH dependence in the absence of a functional permeation pathway by recording gating currents in the monomeric nonconducting D160N mutant. Increasing the ΔpH leftward shifted the gating charge-voltage (Q-V) curve, demonstrating that the ΔpH-dependent gating in Hv1 arises by modulating its voltage sensor. We fitted our data to a model that explicitly supposes the Hv1 voltage sensor free energy is a function of both the proton chemical and the electrical potential. The parameters obtained showed that around 60% of the free energy stored in the ΔpH is coupled to the Hv1 voltage sensor activation. Our results suggest that the molecular mechanism underlying the Hv1 ΔpH dependence is produced by protons, which alter the free-energy landscape around the voltage sensor domain. We propose that this alteration is produced by accessibility changes of the protons in the Hv1 voltage sensor during activation.

Keywords: Hv1; coupling; gating currents; pH dependence; voltage sensor.


Conflict of interest statement

The authors declare no competing interest.

Figures

Fig. 1.
Fig. 1.
Monomeric Hv1 currents were ΔpH dependent. Representative current recordings of monomeric Hv1 at (A) ΔpH = 0, (B) ΔpH = 1, and (C) ΔpH = 2. Insets show the tail currents in an expanded time and current scale. Note the superposition of tail currents at high voltages suggesting that the open probability reached its maximum value. (D) Mean G-V curves at the indicated pHin/pHex obtained from the tail currents. Curves were fitted using a two-state Boltzmann distribution model (lines; Eq. 1 in text and SI Appendix, Table S1). (E) Mean activation time constant as a function of voltage at the indicated pHin/pHex (Eq. 2 in text). Data are shown as mean ± SEM.
Fig. 2.
Fig. 2.
Gating currents of the monomeric D160N Hv1 mutant channel conserved their distinctive characteristics. Currents produced in patches of membranes expressing the monomeric D160N Hv1 mutant at symmetrical pH 7 are shown. A -P/8 subtraction protocol from a subholding potential of −90 mV was applied. (A) Superimposed traces of gating currents produced by depolarizations from a holding potential of −90 mV. Gating currents were elicited by voltages from −60 to 240 mV in 10 mV steps. (B) Superimposed traces of currents produced by a 200-mV depolarization pulse of increasing duration. Holding potential was −90 mV. (C) Superimposed traces of currents produced by an ON-recovery protocol consisting of two 200-mV depolarization pulses separated by returning to −90 mV at increasing durations. Holding potential was −90 mV. (D) A Cole–Moore shift effect was produced when a 200-mV depolarization was preceded by a prepulse at the indicated voltage.
Fig. 3.
Fig. 3.
Gating currents of monomeric D160N Hv1 mutant were ΔpH dependent. Currents produced in patches of membranes expressing the monomeric D160N Hv1 mutant at different pHs were measured. A -P/8 subtraction protocol from a subholding potential of −90 mV was applied. Representative recordings at (A) ΔpH = 0, (B) ΔpH = 1, and (C) ΔpH = 2 are shown. (D) Mean Q-V curves at the indicated pHin/pHex. Curves were fitted using a two-state Boltzmann distribution model (lines; Eq. 4 and SI Appendix, Table S2). (E) Mean ON-gating current decay time constant as a function of voltage at the indicated pHin/pHex. (Eq. 3 in text). Data are shown as mean ± SEM.
Fig. 4.
Fig. 4.
The Q-V and G-V curves were well fitted to the empirical equation accounting for the ΔpH-dependent shifts. The normalized charge or conductance was globally fitted using a least-squares minimization method to the empirical equation 1/{1 + exp[(ΔG0 − 2.3εRTΔpH − zFV)/RT]} (Eq. 6). (A) Q-V curves of the monomeric D160N Hv1 mutant at different ΔpHs shown in Fig. 3D were globally fitted to Eq. 6. The lines are the curves obtained from the fit at the indicated ΔpH using the parameters ΔG0 = 12.3 ± 0.3 kJ/mol, ε = 0.57 ± 0.02, and z = 0.91 ± 0.02. (B) G-V curves of the monomeric Hv1 at different ΔpHs shown in Fig. 1D were globally fitted to Eq. 6. The lines are the curves obtained from the fit at the indicated ΔpH using the parameters ΔG0 = 8.9 ± 0.1 kJ/mol, ε = 0.51 ± 0.01, and z = 0.75 ± 0.01. V0.5 and V0 values calculated from the global fit parameters using Eq. 11 are listed in SI Appendix, Table S3.
Fig. 5.
Fig. 5.
Water densities of the Hv1 voltage sensor changed during activation. (A) The crystal structure of the intermediate-resting state of the mouse Hv1 (mHv1-IR) was used as a template to build a homology model of the intermediate-resting state of the Ciona-Hv1 (CiHv1-IR, red). The active model of CiHv1 (CiHv1-A, black) was built by displacing the S4 arginines in the alignments (above; R255, R258, and R261 in red). A representative snapshot of the 100 ns molecular dynamics simulation is shown below with the S4 arginines in licorice representation for the CiHv1-IR (red) and CiHv1-A (black). (B) The relative densities of the arginine residues and water with respect to bulk water (P/P0) along the cylindrical pore axis (z-axis) for the CiHv1 models. The CiHv1-IR model maintains the arginines in a lower position (Left, red trace) compared to the CiHv1-A model (Right, black trace). For both models, the water density is shown in the blue traces.

References

    1. DeCoursey T. E., Voltage and pH sensing by the voltage-gated proton channel, HV1. J. R. Soc. Interface 15, 20180108 (2018). - PMC - PubMed
    1. Mozhayeva G. N., Naumov A. P., Effect of surface charge on the steady-state potassium conductance of nodal membrane. Nature 228, 164–165 (1970). - PubMed
    1. Carbone E., Testa P. L., Wanke E., Intracellular pH and ionic channels in the Loligo vulgaris giant axon. Biophys. J. 35, 393–413 (1981). - PMC - PubMed
    1. Hille B., Charges and potentials at the nerve surface. Divalent ions and pH. J. Gen. Physiol. 51, 221–236 (1968). - PMC - PubMed
    1. Iijima T., Ciani S., Hagiwara S., Effects of the external pH on Ca channels: Experimental studies and theoretical considerations using a two-site, two-ion model. Proc. Natl. Acad. Sci. U.S.A. 83, 654–658 (1986). - PMC - PubMed

Publication types

MeSH terms

LinkOut - more resources