

Comment
doi: 10.1038/s41598-021-88714-6.
8806 Russian patients demonstrate T cell count as better marker of COVID-19 clinical course severity than SARS-CoV-2 viral load
Affiliations
- PMID: 33941816
- PMCID: PMC8093219
- DOI: 10.1038/s41598-021-88714-6
Item in Clipboard
Comment
8806 Russian patients demonstrate T cell count as better marker of COVID-19 clinical course severity than SARS-CoV-2 viral load
Sci Rep.
.
Abstract
The article presents a comparative analysis of SARS-CoV-2 viral load (VL), T lymphocyte count and respiratory index PaO2:FiO2 ratio as prospective markers of COVID-19 course severity and prognosis. 8806 patients and asymptomatic carriers were investigated in time interval 15 March-19 December 2020. T cell count demonstrated better applicability as a marker of aggravating COVID-19 clinical course and unfavourable disease prognosis than SARS-CoV-2 VL or PaO2:FiO2 ratio taken alone. Using T cell count in clinical practice may provide an opportunity of early prediction of deteriorating a patient's state.
Conflict of interest statement
The author declares no competing interests.
Figures

Correlation between reversed PaO2/FiO2 ratio as an indicator of COVID-19 respiratory complications severity (the first item in ARDS score formula) and SARS-CoV-2 VL. In this and subsequent figures Confidence interval (CI) is 95%. Standard error of mean is showed as whiskers. Green dash-dotted line stands for the conditional border between asymptomatic carriers and symptomatic patients. Red dash-dotted line stands for the conditional border between extremely severe clinical cases and the rest of the patients. Percentage numbers in parentheses (green) correspond to the proportion of asymptomatic carriers whose manifestations fit into the conditional range to the left of the green line. Created in OriginPro ver. 9.2.196, https://www.originlab.com .

Correlation between leukocyte count in serum on logarithm of SARS-CoV-2 VL. Created in OriginPro ver. 9.2.196, https://www.originlab.com .

Correlation between B1 cell (light green line) and plasma cell (dark green line) counts in serum on logarithm of SARS-CoV-2 VL. Created in OriginPro ver. 9.2.196, https://www.originlab.com .
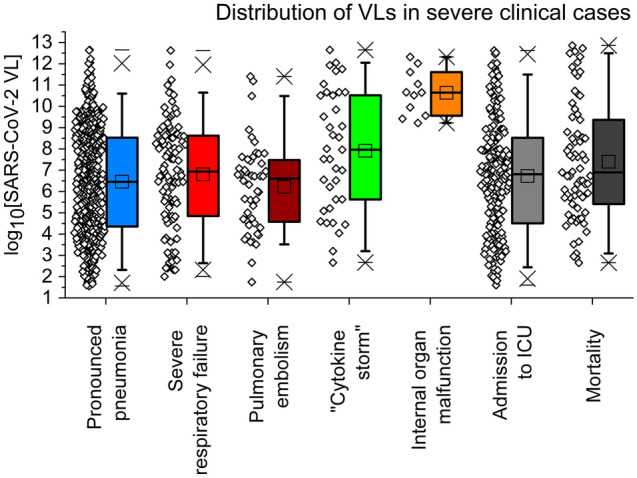
Distribution of SARS-CoV-2 VLs in severe clinical cases: (1) serious viral interstitial pneumonia with X-ray computer tomography opaqueness not less than 15% (469 cases, 5.33%); (2) severe respiratory failure of type 1 [either of PaO2/FiO2 ratio < 280 mmHg OR respiratory rate > 30 min–1 OR SpO2 < 90% (ARDS score AS > 10–12)] (103 cases, 1.17%); (3) pulmonary embolism (48 cases, 0.55%); (4) immune response dysregulation known as “cytokine storm” (37 cases, 0.42%); (5) internal organ malfunction (11 cases, 0.12%); (6) transfer from general ward to ICU (202 cases, 2.29%); (7) lethal outcome (71 cases, 0.81%). Individual cases and statistical boxes are visualised along each other. Boxes: 25/50/75%. Whiskers: 5/95%. Horizontal lines are maximums/minimums, crosses stand for 1/99%. Created in OriginPro ver. 9.2.196, https://www.originlab.com .

T cell count dependence on logarithm of SARS-CoV-2 VL. Piecewise and smooth approximations are shown. Green dash-dotted line stands for the conditional border between asymptomatic carriers and symptomatic patients. Red dash-dotted line stands for the conditional border between extremely severe clinical cases and the rest of the patients. Percentage numbers in parentheses (green) correspond to the proportion of asymptomatic carriers whose manifestations fit into the conditional range to the left of the green line. (A) T killer (CD8+ cytotoxic lymphocyte) count (in serum) dependency on log10VL. (B) Th1 helper (CD4+ CD94 + lymphocyte) count (in serum) dependency on log10VL. (C) γδT and NKT lymphocyte counts (in serum) dependency on log10VL. (D) CD8αα+ lymphocyte count (in pharynx MALT analysed in nasopharyngeal or oropharyngeal swabs) dependency on log10VL. Created in OriginPro ver. 9.2.196, https://www.originlab.com .

T cell count dependence on respiratory factor reversed PaO2/FiO2 ratio. Linear piecewise approximation is shown. (A) T killer and NKT cell counts dependency on PaO2/FiO2 ratio. (B) γδT and CD8αα+ cell counts dependency on PaO2/FiO2 ratio. Created in OriginPro ver. 9.2.196, https://www.originlab.com .

Dependence of in-group mortality percentage on VL (A) and CF1 (B), experimental data and approximation. For detailed description please see the text. Created in OriginPro ver. 9.2.196, https://www.originlab.com .
Comment on
-
A clinical risk score to identify patients with COVID-19 at high risk of critical care admission or death: An observational cohort study.J Infect. 2020 Aug;81(2):282-288. doi: 10.1016/j.jinf.2020.05.064. Epub 2020 May 29. J Infect. 2020. PMID: 32479771 Free PMC article.
-
Laboratory characteristics of patients infected with the novel SARS-CoV-2 virus.J Infect. 2020 Aug;81(2):205-212. doi: 10.1016/j.jinf.2020.06.039. Epub 2020 Jun 21. J Infect. 2020. PMID: 32579986 Free PMC article. Review.
References
-
- Valba OV, Avetisov VA, Gorsky AS, Nechaev SK. Evaluating ideologies of coronacrisis-related self-isolation and frontiers closing by SIR compartmental epidemiological model. Beacon J. Stud. Ideol. Ment. Dimens. 2020;3(2):020210318.
Publication types
MeSH terms
LinkOut - more resources
Full Text Sources
Other Literature Sources
Medical
Miscellaneous
