. 2021 May 3;4(1):512.
doi: 10.1038/s42003-021-02031-2.

Environmental DNA provides higher resolution assessment of riverine biodiversity and ecosystem function via spatio-temporal nestedness and turnover partitioning

Affiliations

Environmental DNA provides higher resolution assessment of riverine biodiversity and ecosystem function via spatio-temporal nestedness and turnover partitioning

Mathew Seymour et al. Commun Biol. .

Abstract

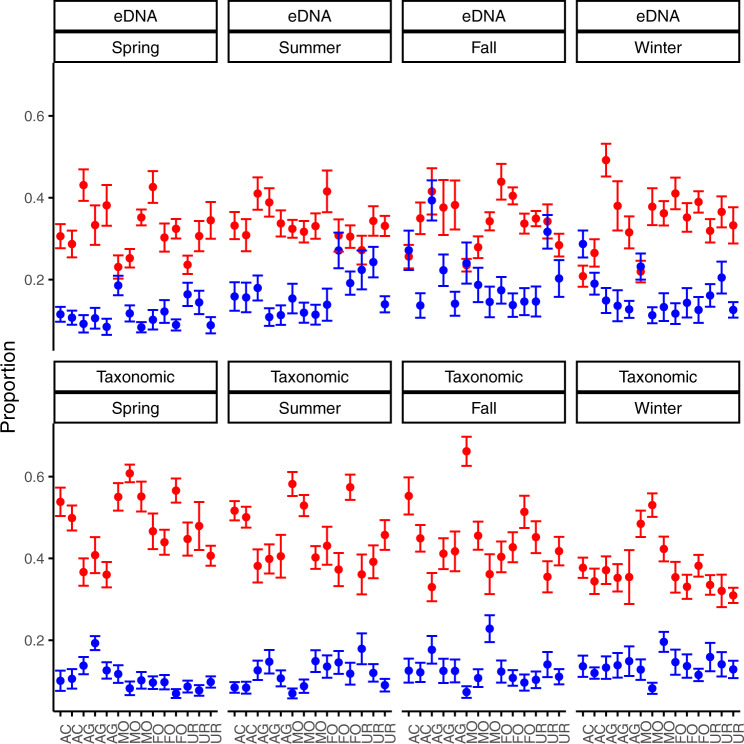
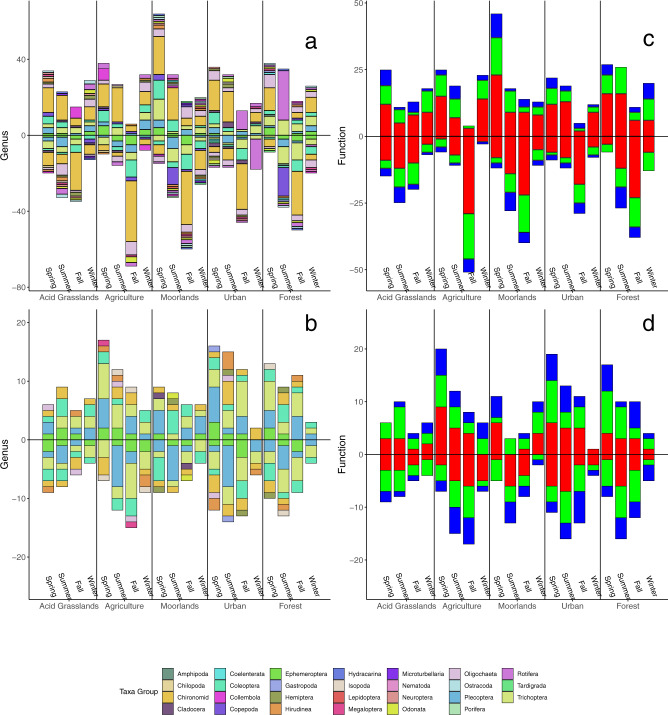
Rapidly assessing biodiversity is essential for environmental monitoring; however, traditional approaches are limited in the scope needed for most ecological systems. Environmental DNA (eDNA) based assessment offers enhanced scope for assessing biodiversity, while also increasing sampling efficiency and reducing processing time, compared to traditional methods. Here we investigated the effects of landuse and seasonality on headwater community richness and functional diversity, via spatio-temporal dynamics, using both eDNA and traditional sampling. We found that eDNA provided greater resolution in assessing biodiversity dynamics in time and space, compared to traditional sampling. Community richness was seasonally linked, peaking in spring and summer, with temporal turnover having a greater effect on community composition compared to localized nestedness. Overall, our assessment of ecosystem function shows that community formation is driven by regional resource availability, implying regional management requirements should be considered. Our findings show that eDNA based ecological assessment is a powerful, rapid and effective assessment strategy that enables complex spatio-temporal studies of community diversity and ecosystem function, previously infeasible using traditional methods.


Conflict of interest statement

The authors declare no competing interests.

Figures

Fig. 1
Fig. 1. Map of the study area (Conwy Catchment, North Wales).
Colors colors correspond to different landuse types, including agriculture (blue), bog/moorland (brown), acid grassland (pink), forested (green), and urban areas (black). White circles indicate sampling locations (N = 14).
Fig. 2
Fig. 2. Environmental variation across landuse types.
Box plots for each environmental variable (y-axis) sampled in the study, as a single panel across sites (N = 14). The colors in each plot match the colors in Fig. 1 for each landuse type (x-axis). The range of the boxplots extends to the minimum and maximum of their corresponding ranges.
Fig. 3
Fig. 3. Traditional vs eDNA biodiversity similarity across landuse types.
Venn diagrams showing the proportion of genera detected for each sampling method (eDNA = blue, traditional = orange) across each landuse type. Sample sizes were 56 for eDNA (average of each sites’ 3 replicate samping) and 56 for traditional sampling.
Fig. 4
Fig. 4. Genera, Chironomidae, EPT and functional spato-temporal richness patterns for eDNA and traditional methods.
Box plots showing the richness diversity per season (left panels), and landuse (right panels) for genera (top), Chironomidae (second from the top), EPT (second from the bottom) and functional diversity (bottom). Blue indicates eDNA derived data and orange indicates traditional method derived data. Error bars are drawn to 1.5 * inter-quartile range (IQR), with outlier points being the data outside the 1.5 * IQR range. Sample sizes were 56 for eDNA (average of each sites’ 3 replicate samping) and 56 for traditional sampling.
Fig. 5
Fig. 5. Beta-diversity partitioning of traditional and eDNA biodiversity.
Beta-diversity results partitioned into turnover (red) and nestedness (blue) components. Showing differences between methods (eDNA vs Taxonomic), season (Spring, Summer, Fall, Winter), with each site provided along the x-axis indicating its landuse type (AC = acid grassland, AG = agriculture, MO = moorland, FO = forest, UR = urban). Error bars are drawn to 1.5 * inter-quartile range (IQR). Turnover was significantly greater than nestedness across landuse and seasons (p < 0.001), following a gls model that accounted for spatial autocorrelation in its variance structure via a pairwise distance matrix. Sample sizes were 56 for eDNA (average of each sites’ 3 replicate samping) and 56 for traditional sampling.
Fig. 6
Fig. 6. Family and functional community compositional change over time.
Change in genera richness for eDNA (a) and traditional sampling (b) and the associated change in function for eDNA (c) and traditional (d) sampling. Each subpanel is a unique landuse type showing the sequential change in genera or function whereby values above the line indicate additions in genera or function compared to the previous season and values below the horizontal line indicate loses. Colors for the genera plots are unique taxa groups, provided in the legend, and each value along the y-axis is a unique genus loss or gain. Functional group colors are: scraper = blue, collector = red, gatherer = green. Sample sizes were 56 for eDNA (average of each sites’ 3 replicate samping) and 56 for traditional sampling.

References

    1. Díaz, S. et al. Summary for policymakers of the global assessment report on biodiversity and ecosystem services of the Intergovernmental Science-Policy Platform on Biodiversity and Ecosystem Services. Nat. Resour. Environ.34, (2020).
    1. Laureto LMO, Cianciaruso MV, Samia DSM. Functional diversity: an overview of its history and applicability. Nat. Conserv. 2015;13:112–116. doi: 10.1016/j.ncon.2015.11.001. - DOI
    1. Gilbey J, et al. Life in a drop: Sampling environmental DNA for marine fishery management and ecosystem monitoring. Mar. Policy. 2021;124:104331. doi: 10.1016/j.marpol.2020.104331. - DOI
    1. de Chazal J, Rounsevell MDA. Land-use and climate change within assessments of biodiversity change: a review. Glob. Environ. Chang. 2009;19:306–315. doi: 10.1016/j.gloenvcha.2008.09.007. - DOI
    1. Benayas JMR, Newton AC, Diaz A, Bullock JM. Enhancement of biodiversity and ecosystem services by ecological restoration: a meta-analysis. Science. 2009;325:1121–1124. doi: 10.1126/science.1172460. - DOI - PubMed

Publication types

Substances

LinkOut - more resources