. 2021 Aug;46(9):1584-1593.
doi: 10.1038/s41386-021-01018-1. Epub 2021 May 3.

Quantitative standardization of resident mouse behavior for studies of aggression and social defeat

Affiliations

Quantitative standardization of resident mouse behavior for studies of aggression and social defeat

Christine C Kwiatkowski et al. Neuropsychopharmacology. 2021 Aug.

Abstract

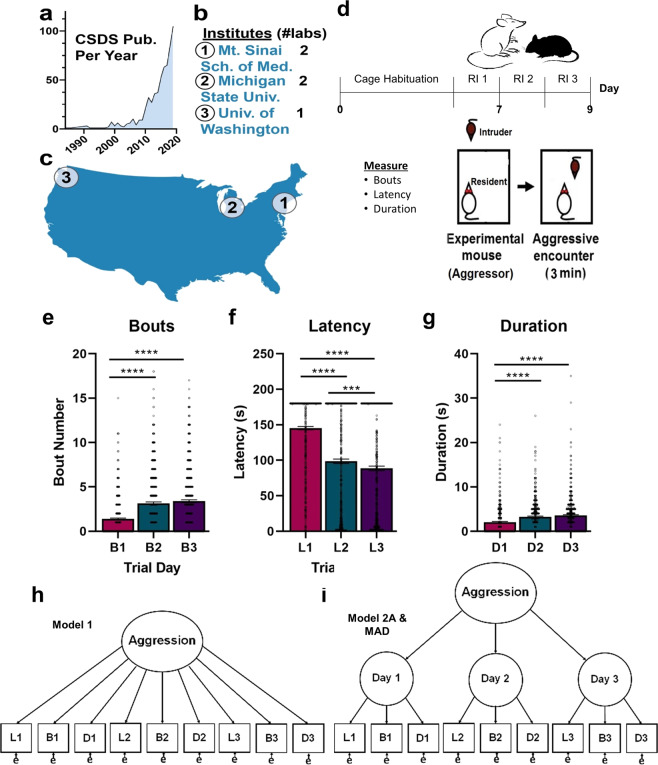
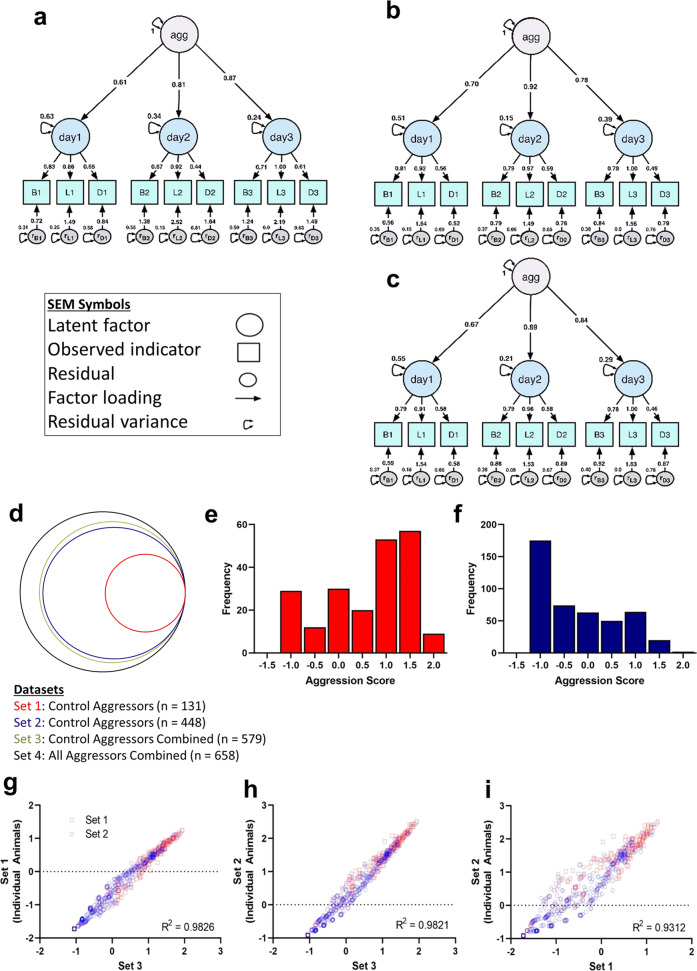
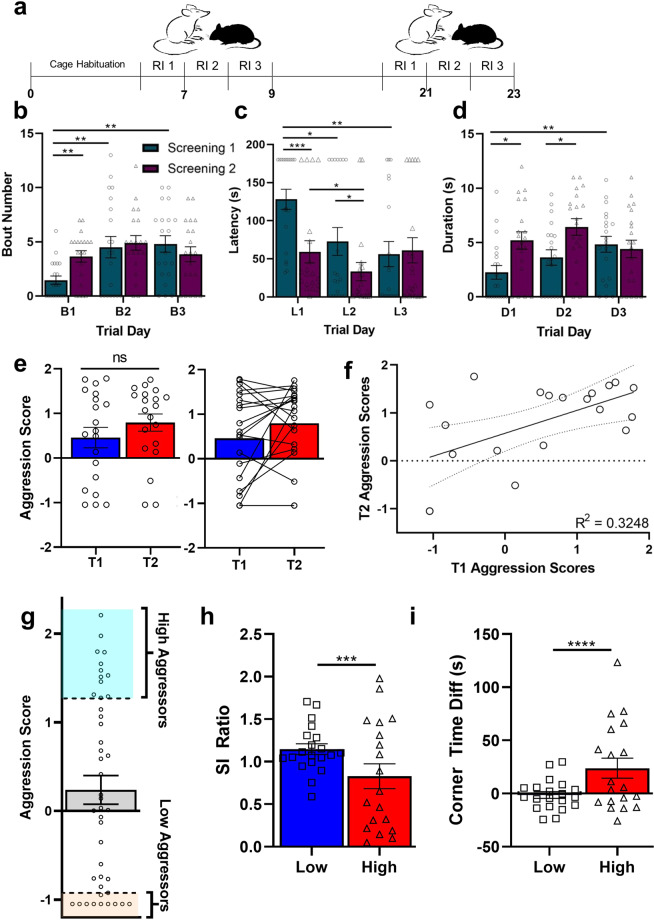
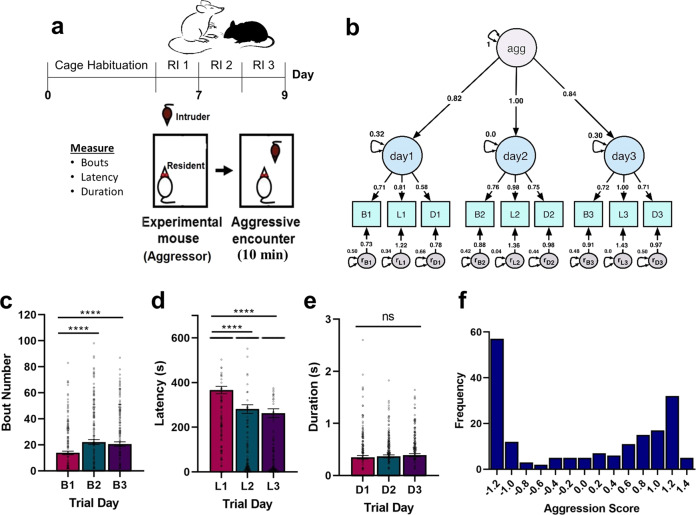
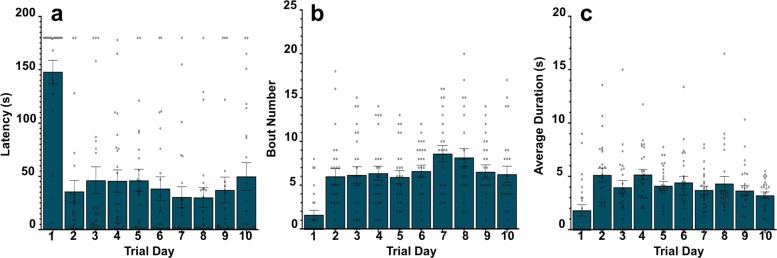
Territorial reactive aggression in mice is used to study the biology of aggression-related behavior and is also a critical component of procedures used to study mood disorders, such as chronic social defeat stress. However, quantifying mouse aggression in a systematic, representative, and easily adoptable way that allows direct comparison between cohorts within or between studies remains a challenge. Here, we propose a structural equation modeling approach to quantify aggression observed during the resident-intruder procedure. Using data for 658 sexually experienced CD-1 male mice generated by three research groups across three institutions over a 10-year period, we developed a higher-order confirmatory factor model wherein the combined contributions of latency to the first attack, number of attack bouts, and average attack duration on each trial day (easily observable metrics that require no specialized equipment) are used to quantify individual differences in aggression. We call our final model the Mouse Aggression Detector (MAD) model. Correlation analyses between MAD model factors estimated from multiple large datasets demonstrate generalizability of this measurement approach, and we further establish the stability of aggression scores across time within cohorts and demonstrate the utility of MAD for selecting aggressors which will generate a susceptible phenotype in social defeat experiments. Thus, this novel aggression scoring technique offers a systematic, high-throughput approach for aggressor selection in chronic social defeat stress studies and a more consistent and accurate study of mouse aggression itself.


Figures

Fig. 1
Fig. 1. Aggression is a composite measure for studies of aggression behavior and chronic social defeat.
a The number of studies using CSDS listed on NIH Pub Med each year since 1985. b Data presented in this manuscript are drawn from aggressor screenings at three different institutes located across the United States (c), performed over the course of 10 years by four separate laboratories. d The resident-intruder procedure is a 3-day behavioral assay that evaluates aggression during a timed social interaction. After habituation of retired breeder male CD-1 aggressors to the home cage, a different male C57BL/6J intruder is introduced for 3 min per day on each of 3 days. Attack features including bouts, latency, and duration are recorded for each resident mouse. eg Among experimentally naïve aggressors (Set 3; n = 579), there was main effect of trial day for bouts (p < 0.0001), latency (p < 0.0001), and duration (p < 0.0001). e The number of bouts increased on day 2 versus day 1 (p < 0.0001) and day 3 versus day 1 (p < 0.0001). f Latency decreased across all trial days (p < 0.001). g Duration increased only on days 2 and 3 when compared to day 1 (p < 0.0001). Together, bout, latency, and duration measurements generate nine observed variables that can be structured in an (h) first-order or (i) second-order measurement model to calculate an aggression score. ****p < 0.0001, ***p < 0.001, **p < 0.01, *p < 0.05; error bars indicate SEM.
Fig. 2
Fig. 2. Aggression scores are significantly correlated across datasets.
The final model (MAD) is a second-order measurement model wherein the observed variables are grouped by trial day before loading onto the higher-order factor, aggression. ac In each path diagram, circles represent latent (unobservable) factors, including an overall aggression score as well as a behavior score on days 1–3, while squares represent the observed indicators, bouts, latency, and duration, on days 1–3, and small circles with double-headed arrows represent indicator residuals and residual variance. Arrows containing factors loadings, or regression weights, are interpreted as regression coefficients, denoting the change in the indicated variable, latent or observed, for every one unit change in the higher-order factor the arrow descends from. These values along with other model estimates are used in a multivariate formula to calculate aggression scores. MAD was developed three times using experimentally naïve aggressor data, thereby generating model estimates unique to (a) Set 1 (n = 131), b Set 2 (n = 448), and (c) Set 3 (n = 579). di Application of MAD to Sets 1–3 generated three sets of model parameters from which three sets of aggression scores were calculated for Set 4 (n = 658). d Schematic representing the four primary datasets used in this analysis. The distributions of aggression scores calculated with Set 3 model estimates are depicted in separate histograms for (e) Set 1 and (f) Set 2 datasets. Correlation analyses showed positive relationships between scores calculated using (g) Sets 1 and 3 parameters (p < 0.0001); h Sets 2 and 3 parameters (p < 0.0001); and (i) Sets 1 and 2 parameters (p < 0.0001).
Fig. 3
Fig. 3. Aggression scores are stable over time and predict CSDS utility.
a Schematic showing experimental timeline. Aggression was measured via the resident-intruder procedure at two different time points beginning on days 7 and 21 in a novel cohort of 20 mice. bd The raw screening data for bouts, latency, and duration on trial days 1–3 are compared between Screening 1 (T1) and Screening 2 (T2). b Across screenings, there was a main effect of trial day (p < 0.001) as well as an interaction effect between trial day and screening (p < 0.05). At T1, there was a increase in bouts on day 2 versus day 1 (p < 0.01) and day 3 versus day 1 (p < 0.01). At T2, there were no differences in bout number between trial days. Between T1 and T2, we found a increase in the number of bouts on day 1 (p < 0.01), but not on days 2 or 3. c For latency, there were main effects of both trial day (p < 0.01) and screening (p < 0.01) as well as an interaction effect between trial day and screening (p < 0.01). At T1, latency decreased compared to day 1 on days 2 (p < 0.05) and 3 (p < 0.01) whereas only latency between days 1 and 2 at T2 (p < 0.05) decreased. Latency on days 1 (p < 0.001) and 2 (p < 0.05) decreased between T1 and T2. d At T1, we found an increase in duration between days 1 and 3 (p < 0.01), but there were no other differences at T1 or T2. Between T1 and T2, there was an increase in duration on days 1 (p < 0.05) and 2 (p < 0.05). e A paired t-test of aggression scores at Time 1 and Time 2 demonstrates no differences in aggression (p > 0.05). Among the top most aggressive animals, however, the majority maintained aggression during the two screenings. f Aggression scores are correlated for individual animals between T1 and T2 (p < 0.01). A simple linear regression analysis demonstrates a relationship between aggression scores at T1 and T2 (p < 0.01). g A cohort of 42 aggressors was screened and those with the top 10 MAD scores (high aggressors) and bottom 10 scores (low aggressors) were chosen for subsequent CSDS. Adult male C57 mice exposed to CSDS with high aggressors showed reduced social interaction (h) and increased time in the corners (i) compared to those exposed to low aggressors. ****p < 0.0001, ***p < 0.001, **p < 0.01, *p < 0.05; error bars indicate SEM.
Fig. 4
Fig. 4. MAD for modeling SimBA data.
a Schematic showing the experimental timeline. Aggression behavior among experimentally naïve, sexually experienced CD-1 male mice (Set 5; n = 182) was measured using the resident-intruder procedure for three consecutive days under video observation, and behavior was evaluated using the SimBA classification toolkit. b Schematic showing the path diagram for MAD model estimates generated using Set 5. Circles represent latent (unobservable) factors, including an overall aggression score as well as a behavior score on days 1–3, while squares represent the observed indicators, bouts, latency, and duration, on days 1–3, and ovals represent error. ce We found a main effect of trial day for bouts (p < 0.0001) and latency (p < 0.0001) but not duration (p > 0.05). c Bouts increased day 2 versus day 1 (p < 0.0001) and day 3 versus 1 (p < 0.0001). d Latency decreased on day 2 versus day 1 (p < 0.0001) and day 3 versus 1 (p < 0.0001). e There were no differences in average bout duration across trial days. f Histogram showing the distribution of aggression scores for Set 5. ****p < 0.0001; error bars indicate SEM.
Fig. 5
Fig. 5. Three trial days are sufficient to characterize aggression.
ac The raw screening data for experimentally naïve, sexually experienced CD-1 male mice (n = 25) during a 10-day resident-intruder screening. a Bout number for days 1–10. Day 1 is different than all other trial days (p < 0.0001). Bout number on day 5 is also different from that of day 7 (p < 0.05). b Latency for days 1–10. Day 1 is different from all other trial days (p < 0.0001). There are no other differences between trial days. c Duration for days 1–10. Day 1 is different (p < 0.001) from days 2–6, but not 7–10. Duration on day 4 is also different from duration on day 10 (p < 0.05).

References

    1. Miczek KA, Faccidomo S, de Almeida RMM, Bannai M, Fish EW, Debold JF. Escalated Aggressive Behavior: New Pharmacotherapeutic Approaches and Opportunities. In: Devine J, editor Youth Violence: Scientific Approaches to Prevention. New York, NY, US: New York Academy of Sciences; 2004. p. 336–55. - PubMed
    1. Golden SA, Jin M, Shaham Y. Animal Models of (or for) Aggression Reward, Addiction, and Relapse: Behavior and Circuits. J Neurosci. 2019;39:3996–4008. - PMC - PubMed
    1. Miczek KA, de Boer SF, Haller J. Excessive aggression as model of violence: a critical evaluation of current preclinical methods. Psychopharmacology (Berl) 2013;226:445–58. doi: 10.1007/s00213-013-3008-x. - DOI - PMC - PubMed
    1. Golden SA, et al. Basal forebrain projections to the lateral habenula modulate aggression reward. Nature. 2016;534:688. doi: 10.1038/nature18601. - DOI - PMC - PubMed
    1. Golden SA, et al. A standardized protocol for repeated social defeat stress in mice. Nat Protoc. 2011;6:1183. doi: 10.1038/nprot.2011.361. - DOI - PMC - PubMed

Publication types

LinkOut - more resources