. 2021 May;18(5):528-541.
doi: 10.1038/s41592-021-01126-2. Epub 2021 May 3.

A versatile polypharmacology platform promotes cytoprotection and viability of human pluripotent and differentiated cells

Affiliations

A versatile polypharmacology platform promotes cytoprotection and viability of human pluripotent and differentiated cells

Yu Chen et al. Nat Methods. 2021 May.

Abstract

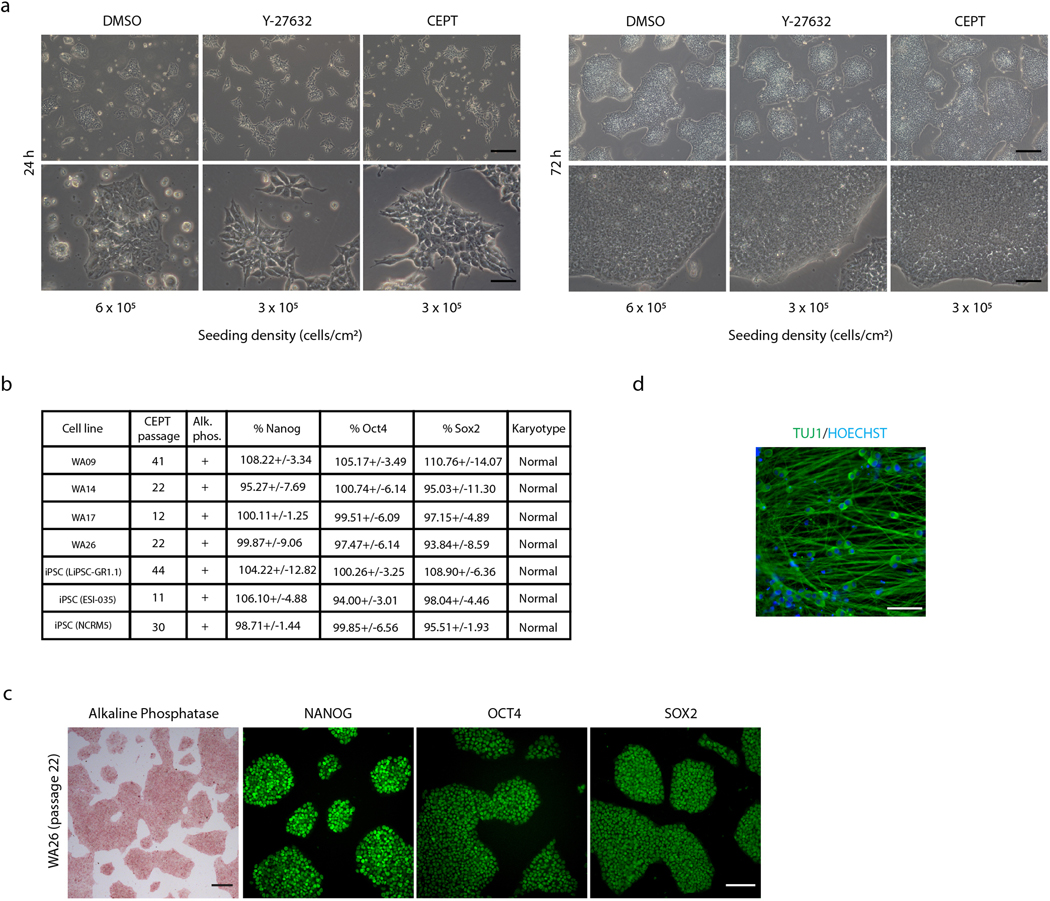
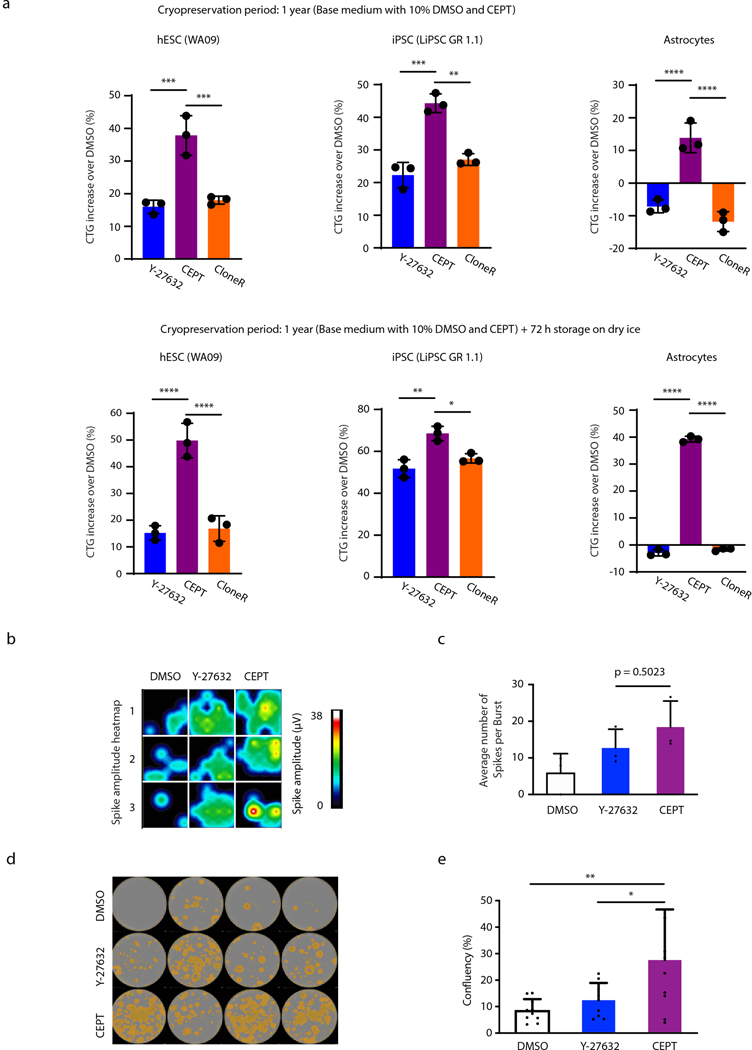
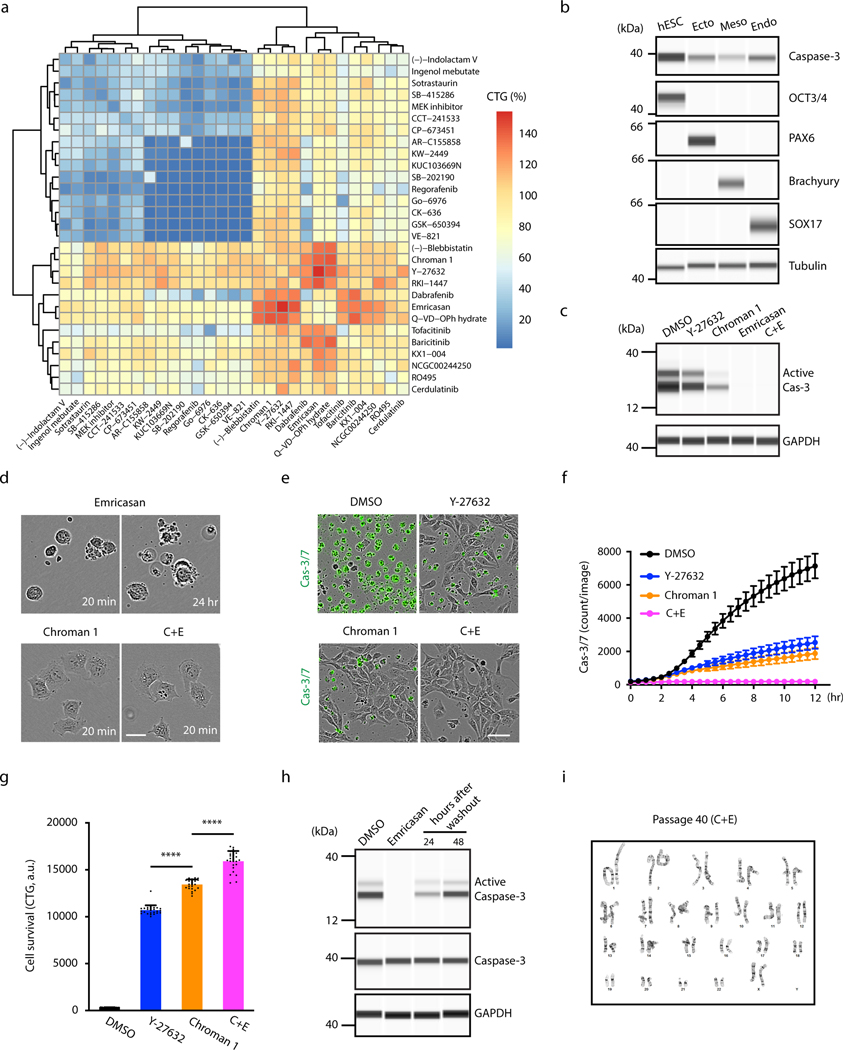
Human pluripotent stem cells (hPSCs) are capable of extensive self-renewal yet remain highly sensitive to environmental perturbations in vitro, posing challenges to their therapeutic use. There is an urgent need to advance strategies that ensure safe and robust long-term growth and functional differentiation of these cells. Here, we deployed high-throughput screening strategies to identify a small-molecule cocktail that improves viability of hPSCs and their differentiated progeny. The combination of chroman 1, emricasan, polyamines, and trans-ISRIB (CEPT) enhanced cell survival of genetically stable hPSCs by simultaneously blocking several stress mechanisms that otherwise compromise cell structure and function. CEPT provided strong improvements for several key applications in stem-cell research, including routine cell passaging, cryopreservation of pluripotent and differentiated cells, embryoid body (EB) and organoid formation, single-cell cloning, and genome editing. Thus, CEPT represents a unique poly-pharmacological strategy for comprehensive cytoprotection, providing a rationale for efficient and safe utilization of hPSCs.


Figures

Extended Data Fig. 1:
Extended Data Fig. 1:. Target specificity and cell passaging with Chroman 1
a, HotSpot kinase profiling was used to individually inhibit a panel of 369 human wild-type kinases using 50 nM Chroman 1 or 10 μM Y-27632 (concentrations were chosen based on dose-response curves and maximum cell survival in the primary screen). Note the significant differences among these two ROCK inhibitors revealing that Chroman 1 is more potent and has fewer off-targets than Y-27632. b, Table summarizing the inhibitory activity of 50 nM Chroman 1 and 10 μM Y-27632 as determined by HotSpot kinase profiling shown in panel (a). Green portion of the table shows values for ROCK1 and ROCK2 as the primary targets, red portion indicates all off-target kinases that Y-27632 inhibits more strongly than Chroman 1. These include PKCeta (also known as PKCη or PRKCH), PKCepsilon (also known as PKCε or PRKCE), PKCdelta (also known as PKCδ or PRKCD), PKN1, PKN2 and PRKX. Two negligible off-target kinases that Chroman 1 inhibits relatively better than Y-27632 are LATS2 (15.32%) and DMPK2 (16.44%) (blue portion). Note that only values under 10% represent significant inhibitory activity according to ref. 16. c, hESCs (WA09) maintained pluripotency and multilineage differentiation potential after serial passaging with Chroman 1 for 40 passages. Scale bar, 2.5 μm.
Extended Data Fig. 2:
Extended Data Fig. 2:. Synergy score examples and long-term culture in C+E
a-d, Checkerboard examples from the matrix screening data. The 10 × 10 viability matrices (a,c) and the delta HSA value matrices (b,d) for the combination of Chroman 1 + Emricasan (a,b), and Chroman 1 + Blebbistatin (c,d). Chroman 1 + Emricasan enhanced the maximum survival compared to either Chroman 1 or Emricasan alone, which indicates synergistic activity. In contrast, Chroman 1 + Blebbistatin failed to further improve cell survival. Yellow boxes highlight the maximum survival and synergy level achieved by the combinations. e,f, hESCs (WA09) were serially passaged for a total of 40 passages with C+E applied for the initial 24 h during every passage. Cells expressed pluripotent genes including NANOG and OCT4, and differentiated into ectoderm (PAX6), mesoderm (Brachyury) and endoderm (SOX17) lineages both by directed differentiation in adherent cultures (e) and spontaneous differentiation in EB cultures followed by Scorecard analysis (f). Scale bar, 2.5 μm.
Extended Data Fig. 3:
Extended Data Fig. 3:. Assay development for ultra-low cell density HTS
a, hESCs (WA09) were single-cell dissociated with Accutase and dispensed into 1536-well plates at the indicated cell densities. Two plates were prepared for each seeding density. CTG reading was carried out with one plate immediately following cell dispensing (read 1) and with the second plate 24 h later (read 2). CTG-fold change was calculated as read 2 divided by read 1 to indicate cell recovery and growth within 24 h. Note the biphasic relationship between cell seeding density and the CTG-fold change, indicating that both high cell density (2000 cells/well) and ultra-low cell density (< 50 cells/well) impeded cell survival. b, Assay development for hESCs (WA09) in 1536-well format to model the stress that is associated with ultra-low cell density on cell survival. Fewer than 50 cells per well was determined as ultra-low cell density (n = 128 wells for the density of 0 and 5; n = 256 wells for the density of 50, 100, 500, and 2000). c, Summary of qHTS performed at ultra-low cell density (10 cells/well) that identified 316 hits showing synergy with C+E (see Supplementary Table 2 for details). All compounds were used in combination with C+E, tested in triplicates, and ranked based on their median CTG readings. Data were normalized to the average CTG reading obtained with C+E. d, Example dose-response curves of Trans-ISRIB, Isotretinoin, and Y-27632. Data represent median ± s.d. (n = 6 wells for each concentrations of all groups).
Extended Data Fig. 4:
Extended Data Fig. 4:. Characterization of hPSC lines after long-term culture with CEPT
a, Phase-contrast images of hESCs (WA09) at 24 h and 72 h post-passage comparing DMSO (control), Y-27632, and CEPT. Twice as many cells were plated in the DMSO group to compensate for poor cell survival after single-cell dissociation with Accutase and plating in E8 Medium without a ROCK inhibitor. Note the absence of debris at 24 h post-passage after CEPT treatment. Scale bar, upper row, 200 μm; lower row, 50 μm. b, Comprehensive analysis of eight cell lines passaged by using CEPT (24 h exposure at each passage). High-content imaging and quantification confirm that the vast majority of cells expressed pluripotency-associated markers. Staining and quantification was performed 3 days after plating using the method B algorithm of the Columbus image analysis system (Perkin-Elmer). Data are mean ± s.d. (n = 4 wells for each group). Karyotyping was carried out at the indicated passage numbers. c, Representative images showing that hESCs grow in colonies and express typical pluripotency-associated markers (Alkaline Phosphatase, NANOG, OCT4, SOX2) after long-term serial passaging with CEPT. Scale bar, 200 μm. d, Representative example demonstrating that hESCs (WA09) passaged by CEPT can be differentiated into neurons and other lineages (data not shown). Scale bar, 200 μm.
Extended Data Fig. 5:
Extended Data Fig. 5:. Whole exome sequencing (WES) of hESCs and iPSCs after serial passaging using CEPT
a,b, To demonstrate that CEPT treatment was safe, hESCs (WA09) and iPSCs (LiPSC-GR1.1) were cultured for 20 passages and exposed to CEPT for 24 h during every passage. Western blots and immunocytochemistry show that both cell lines maintained OCT4 expression and differentiated into ectoderm, mesoderm and endoderm lineages by directed differentiation in adherent monolayer cultures. Scale bars, 100 μm. c-f, WES variant annotations, genotypes, and CNV analysis show genetic stability of cell lines. COSMIC variants by passage number for only exonic, nonsynonymous SNPs in cancer hotspots, split by cell line. There was no change in rarity or genotype over passaging (c). Genotype frequencies by passage number for all SNPs (upper panel) and SNPs in cancer hotspots (lower panel), which were proportionally constant (d). Functional SNP annotations by passage number (left) and exonic functional SNP annotations (right), a subset of the former, with unchanging variant counts per annotation category (e). Indel correlogram showing no significant correlation between key variables, passage number, and genotype. The CLINSIG database was used to analyze indels (f).
Extended Data Fig. 6:
Extended Data Fig. 6:. Improved single-cell cloning by CEPT and karyotype analysis of clonal lines
a, Single-cell cloning experiment in 96-well plates. Single cells were deposited using BD FACSAria Fusion and treated with Y-27632 or CEPT. First medium change was on day 3 in order not to disturb single cells. Whole-well images were captured a 2x objective after calcein green AM staining to quantify clone numbers on day 9. Arrows show single clones in each well. Scale bar, 3.2 mm. b, Quantification of single-cell cloning experiment showing higher colony formation rate after CEPT treatment. Data represent mean ± s.d. (n = 3 plates for each group), ***p = 0.0006, unpaired two-tailed Student’s t-test. c, Single-cell cloning efficiency (WA09) in mTeSR1 medium with microfluidic cell-dispenser Hana shows that CEPT is superior to Y-27632 and comparable to CloneR confirming the broad applicability of CEPT with different cell culture media. Data represent mean ± s.d. (n = 6 plates for each group). ***p = 0.001, one-way ANOVA (see also Fig. 3g-k using StemFlex medium). d, Time-lapse images recorded by Cytena to document stringent single-cell deposition. A single cell, highlighted in green color, was identified by the system in the outgoing droplet (the volume enclosed by the two concentric circles) and dispensed into well A11 in a 96-well plate. e,f, CEPT improves single-cell cloning when Cytena single-cell dispenser is used. Single cells were dispensed using Cytena into 96-well plates coated with LN521 or VN and containing StemFlex media following Accutase dissociation. Clones were stained with calcein green AM 9 days after dispensing and images of the plates were scanned with a 2x objective using INCell Analyzer high content analysis (HCA) System. Single cells survived better and were more migratory on LN521 leading to less compact clones compared to those on VN. Data are mean ± s.d. (e: n = 3 plates for all groups. WA01, **p = 0.0054; WA09, ***p = 0.0005; GM25256, **p = 0.0061; LiPSC-GR1.1, **p = 0.01; f: n = 3 plates for all groups. WA01, **p = 0.0096; WA09, **p = 0.0011; GM25256, ***p = 0.0006; LiPSC-GR1.1, **p = 0.0025; unpaired two-tailed Student’s t-test). g, Time-lapse microscopic images documenting that multiple clusters of pluripotent cells (WA09) arose from a single cell due to cell migration on LN521. Scale bar, 200 μm. h, Single-cell cloning and establishment of eight clonal cell lines from hESCs (WA09) and iPSCs (LiPSC-GR1.1) by using CEPT treatment. All clonal cell lines maintained normal karyotypes as analyzed after passage 4. i-l, CEPT supports cell survival after electroporation. The recovery of one hESC (WA09) and two iPSC (LiPSC-GR1.1 and NCRM5) lines from electroporation was quantified using the CTG assay 24 h post-electroporation. Representative images of cells (WA09) 24 h post-electroporation are shown in (l). Data represent mean ± s.d. (n = 9 wells for each group). Scale bar, 100 μm.
Extended Data Fig. 7:
Extended Data Fig. 7:. Efficient establishment of clonal lines of gene-edited iPSCs.
a, Improved workflow to generate gene-edited clonal cell lines from iPSCs. b, Detection of GFP+ cells 3 days after electroporation. Scale bar, 5 μm. c, Schematic of potential gene editing results with or without the integration of the plasmid backbone (AMP), both of which may lead to the expression and correct localization of GFP. d, Randomly picked GFP+ clones (n = 8) were analyzed for genomic copy numbers of GFP and the plasmid backbone (AMP) using ddPCR. One clone showed bi-allelic correct editing (blue circle), five clones showed mono-allelic correct editing (green circles), and two clones were edited with plasmid integration (red circles). e, Microscopic images of one of the mono-allelic correctly edited clones (clone #5) and the bi-allelic clone (clone #8). Note the stronger GFP signal intensity in the bi-allelic clone. Scale bar, 10 μm; inset, 2 μm. f, Junction PCR to detect the GFP insertion into the N-terminus of LMNB1 in clone #5 and #8. GM25256 represents the parental iPSC line. The intermediate band in clone #5 was also reported by ref. 36, likely representing a heteroduplex of the tagged and untagged allele products. g, Sanger sequencing confirming edited and unedited alleles. h, Western blot analysis of LMNB1 expression in cell lines with mono- and bi-allelic modification and the parental iPSC line (GM25256). i, Gene-edited clonal cell lines (clones #5 and #8) maintained normal karyotypes after expansion. j,k, Differentiation of LMNB1-edited cells (clone #8) into ectoderm (PAX6), mesoderm (Brachyury), and endoderm (SOX17), and neurons (TUJ1).
Extended Data Fig. 8:
Extended Data Fig. 8:. CEPT improves EB differentiation and formation of kidney organoids
a, Graphic summary of spontaneous multi-lineage differentiation of single EBs cultured individually in 96-well ULA plates in chemically defined E6 Medium. The expression of PAX6, SOX17 and Brachyury was measured using RT-PCR (see also Fig. 4f). b, Overview of kidney organoids (one well of 6-well plate) using phase-contrast microscopy and immunocytochemical staining of nephron segment with LTL (Tetragonolobus Lectin), PODXL (Podocalyxin), and ECAD (E-Cadherin). Scale bars, 500 μm. c, Quantification showing that CEPT treatment generated more kidney organoids as compared to Y-27632 and this effect is more pronounced when fewer cells are plated. Data are mean ± s.d. (n = 4 wells for each group), **p = 0.0049, two-way ANOVA.
Extended Data Fig. 9:
Extended Data Fig. 9:. CEPT improves thawing of cryopreserved cells and facilitates colony picking during iPSC line establishment
a, Experiments in upper panel show that long-term cryopreservation and thawing of undifferentiated and differentiated cells (hESCs, iPSCs, astrocytes) in the presence of CEPT is superior to Y-27632 and CloneR. Cell survival was quantified using the CTG assay. In independent experiments (lower panel), long-term cryopreserved cells were placed on dry-ice for 72 h to simulate shipment and then thawed and analyzed at 24 h post-plating. Data are mean ± s.d. (n = 3 wells for each group). Upper row: WA09, ***p = 0.0002 for Y-27632 v.s CEPT, ***p = 0.0009 for CloneR v.s CEPT; LiPSC GR1.1, ***p = 0.0009 for Y-27632 v.s CEPT, **p = 0.0015 for CloneR v.s CEPT; Astrocytes, ****p = 0.0006 for Y-27632 v.s CEPT, ****p = 0.0002 for CloneR v.s CEPT; Lower row: WA09, ****p = 0.0003 for Y-27632 v.s CEPT, ****p = 0.0004 for CloneR v.s CEPT; LiPSC GR1.1, **p = 0.0023 for Y-27632 v.s CEPT, *p = 0.0126 for CloneR v.s CEPT; Astrocytes, ****p < 0.0001 for both comparisons. One-way ANOVA with Tukey post-hoc test. b,c, Frozen vials of iPSC-derived motor neurons (FUJIFILM CDI) were thawed and treated with Y-27632 and CEPT for 24 h. Electrophysiological characterization of motor neurons was recorded using multi-electrode array technology. Note the higher spontaneous activity of neuronal cultures thawed with CEPT (recordings performed at 7 days after plating cells). Data are mean ± s.d. (n = 3 wells for each group). p = 0.5023, one-way ANOVA. d,e, Human skin fibroblasts were reprogrammed using the Yamanaka factors and emerging individual iPSC colonies were manually picked and transferred to new plates. At day 8, cell confluency was measured demonstrating that CEPT yields more cellular material for cell line establishment. Data represent mean ± s.d. (n = 10 wells for each group), **p = 0.0044, *p = 0.0292, one-way ANOVA.
Extended Data Fig. 10:
Extended Data Fig. 10:. CEPT confers cytoprotection during passaging of hPSCs and demonstration of normal cellular stress response in the presence of CEPT
a, Western blot analysis of iPSCs (LiPSC-GR1.1) showing cellular stress at 3 h post-passage in the presence of DMSO and Y-27632. Note that CEPT protects cells, which are more similar to the condition prior to passage (“no passage” served as control). See also Fig. 6f showing similar results using hESCs. b, Western blot analysis of cell membrane-associated proteins. Human iPSCs (LiPSC-GR1.1) were dissociated and exposed to Y-27632 or CEPT for 24 h. Note that all proteins are expressed at higher levels after CEPT treatment. GAPDH was used as a loading control. Similar results were obtained using hESCs (see Fig. 6e). c, Puromycin pulse-chase experiment demonstrating that CEPT-treated iPSCs (LiPSC-GR1.1) show higher protein synthesis capacity than cultures passaged with Y-27632. Note that protein synthesis is completely stalled in the presence of DMSO indicating cellular stress after single-cell dissociation with Accutase. All experiments were performed at 3 h post-passage and samples were collected after 50 min of puromycin exposure. See also Fig. 6g showing similar results with hESCs. d, Measurement of glutathione levels in two hESC lines and three iPSC lines. Glutathione levels were consistently higher in CEPT treated cultures compared to DMSO and Y-27632. Data represent mean ± s.d. (n = 4 wells for each group). WA01, ****p < 0.0001 for both comparison; WA07, **p = 0.0071 and ***p = 0.0002; GM23476, ****p < 0.0001 and ***p = 0.0001; GM25256, ****p < 0.0001 and ns = 0.0952; GM26107, ****p < 0.0001 and **p = 0.0075; one-way ANOVA. See also Fig. 6h showing similar results for the WA09 cell line. e, Dose-response experiment showing that increasing concentrations of etoposide correlate with enhanced signal for γH2AX in hESCs (WA09) as measured by Western blotting. f, hESCs (WA09) were treated with 340 μM etoposide for 3 h. Note that CEPT treatment reduces γH2AX levels with and without etoposide treatment. g, hESCs (WA09) treated with CEPT show expected physiological stress-response to etoposide-induced DNA damage and strongly induce γH2AX, p21, p53, and phosphorylation of BRCA1, CHK2, and p53. Cells were treated with 340 μM etoposide for 3 h.
Fig. 1:
Fig. 1:. Quantitative HTS identifies Chroman 1 as best-in-class ROCK inhibitor.
a, Cell survival assay in 1536-well format for qHTS. Cell viability was assessed after compound exposure for 24 h using CellTiter-Glo (CTG) to measure cellular ATP levels of live cells. b, Chemical structure similarity analysis of active compounds. Point size correlates with maximum survival achieved by the compound at all tested concentrations. Two compounds are connected in the similarity network when their chemical structures are similar (Tanimoto coefficient > 0.17). Color indicates the primary target (orange = AGC protein kinases; yellow = other protein kinases, green = caspases, gray = other targets). c, Dose-response curves of selected ROCK inhibitors including Chroman 1, Fasudil, Thiazovivin and Y-27632 (n = 4 wells at each concentration of all groups). CTG readings were normalized to the average number obtained with 10 μM Y-27632 (control). Note that Thiazovivin shows toxic effects at higher concentrations. d,e, Potency of Y-27632 and Chroman 1 against their primary targets ROCK1 and ROCK2 as determined by the HotSpot kinase assay (see also Extended Data Fig. 1a,b). f,g, Improved survival of hESCs (WA09) with Chroman 1 treatment. Cells were dissociated with EDTA or Accutase and plated on VN in E8 Medium at 100,000 cells/cm. Phase contrast and fluorescence images were taken 12 h after plating. Live and dead cells were stained with calcein green AM and propidium iodide (PI), respectively. Data represent mean ± s.d., n = 3 wells for each group, and 36 fields of view were analyzed for each well. ***p = 0.0004 for both comparison, one-way ANOVA. Scale bar, 100 μm. h, hESCs (WA09) maintained a normal karyotype after serial passage (40 passages) with Chroman 1 applied for the initial 24 h during every passage.
Fig. 2:
Fig. 2:. Combinatorial matrix screen identifies compounds with synergistic activities.
a, Heatmap summarizing the maximum CTG readings of all-versus-all dose matrices for 29 compounds (812 drug-drug combinations tested in total; see also Extended Data Fig. 2a-d for examples showing 10 × 10 checkerboard dose matrices). CTG readings were normalized to the value obtained with 10 μM Y-27632 representing 100% (control). b, Total caspase-3 expression in hESCs (WA09) in comparison to their lineage-committed precursors after directed differentiation into ectoderm (PAX6), mesoderm (Brachyury), and endoderm (SOX17). Note that caspase-3 is strongly expressed in the pluripotent state and downregulated upon differentiation. c, Western blot analysis of caspase-3 activation in response to single-cell dissociation. Cells were dissociated with Accutase and plated on VN in the presence of indicated compounds. Cell lysates were collected after 2 h-treatment, and caspase-3 activation (indicated by the cleaved version of caspase-3) was measured. d, Live-cell imaging showing differences in cell behavior and survival upon treatment with Emricasan, Chroman 1 or C+E. Cells were dissociated with Accutase and plated on VN in the presence of indicated compounds. Cell blebbing continued in the presence of Emricasan and cells failed to attach to coated plates, eventually leading to cell death. In contrast, hESCs attached within 20 min when treated with either Chroman 1 or C+E. Scale bar, 25 μm. See also Supplementary Movie 1. e-g, Combination of Chroman 1 with Emricasan (C+E) improves cell survival and reduces the number of apoptotic cells. hESCs (WA09) cells were dissociated with Accutase and plated on VN in E8 medium (100,000 cells/cm2). Caspase-3/7 green detection reagent was used to monitor caspase activation (e,f) and CTG was used to quantify viable cells 24 h post-seeding (g). Data represent mean ± s.d. (n = 25 fields of view for each group in f; n = 24 wells for each group in g), ****p < 0.0001 for both comparison, one-way ANOVA. Scale bar, 50 μm. h, Emricasan effect on cleaved caspase-3 levels. Emricasan efficiently blocked activation of caspase-3 in response to cell dissociation but did not impact total caspase-3 levels. Note that cleaved caspase-3 is detectable 24–48 h after Emricasan washout. i, hESCs (WA09) maintained a normal karyotype after serial passage for a total of 40 passages with C+E applied for the initial 24 h during every passage.
Fig. 3:
Fig. 3:. Combination of Chroman 1, Emricasan, Polyamines and Trans-ISRIB promotes clonal growth and expansion of genetically stable hPSCs.
a, Secondary combination screening validates multiple hits showing synergistic activity with C+E in promoting cell survival at ultra-low cell density. hESCs (WA09) were plated on LN521 at 25 cells/cm in StemFlex medium. After a 3-day incubation with compounds (in order not to disturb cells with early media changes), live cell numbers were quantified using calcein green AM on day 6. Data are presented as box plot (n = 6 wells for each group). Cell survival index represents cell numbers normalized to the C+E control group. Boxed area shows chemical structure of Trans-ISRIB, which had the strongest synergy with C+E among all hits. b,c, CEPT combination is the most superior condition for cell survival. hESCs (WA09) were plated on LN521 at 25 cells/cm2 in StemFlex medium. After a 3-day incubation with compounds, cells were stained on day 6 with alkaline phosphatase (c) and calcein green AM (b). Data are mean ± s.d. n = 6 wells for each group, ****p < 0.0001 for both Y-27632 v.s. CET and Y-27632 v.s. CEPT, ***p = 0.0002 for Y-27632 v.s. CEP, one-way ANOVA. Scale bars, 300 μm. d, Impedance-based continuous analysis of hESCs (WA09) shows that polyamines and Trans-ISRIB support cell attachment when added to C+E (CEP and CET), whereas CEPT is the most optimal condition. Data are mean ± s.e.m., n = 5 biological replicates for Y-27632, C+E, CEP, CET, n = 6 biological replicates for CEPT, and n = 7 biological replicates for Chroman 1. e, Puromycin pulse-chase experiments using hESCs (WA09) and iPSCs (LiPSC-GR1.1) reveal that protein synthesis is impaired during routine cell passaging (3 h post-plating). Note the positive effects of polyamines and Trans-ISRIB when added to C+E (CEP and CET) but CEPT is the most favorable condition. f, Pearson correlogram and significance of 95% confidence interval (X = not significant, color indicates direction of correlation) summarizing that there was no correlation between cell line, passage number or SNP genotype after hESCs were passaged for 20 passages using CEPT (24 h treatment at each passage). See also Extended Data Fig. 5c-f for more details. g, Microfluidic cell sorter Hana used for fast and gentle single-cell dispensing. h, Comparison of cloning efficiency using different hESC (WA01, WA09, HUES53) and iPSC (JHU078i) lines after cell sorting using Hana. Data are mean ± s.d. (WA01, n = 5 plates for both groups, **p = 0.0028; WA07, n = 4 plates for both groups, ****p < 0.0001; HUES53, n = 4 plates for both groups, **p = 0.0023; JU078i, n = 4 plates for Y-27632 and n = 6 plates for CEPT, **p = 0.0020). Unpaired two-tailed Student’s t-test. i, Microfluidic cell dispensing of hESCs (WA09) and treatment with Y-27632, CEPT, and CloneR. Representative overview of 96-well plates showing alkaline phosphatase-positive clones. j, Quantification of cloning experiments shown in (i). Cells were stained for alkaline phosphatase and quantification was performed 9 days after sorting single cells into 96-well plates. Data are mean ± s.d. (n = 4 plates for each group, ****p < 0.0001 for both comparisons), one-way ANOVA. k, Live-cell imaging showing that CEPT enables single cell survival and growth into a clonal colony. See also Supplementary Movie 2. Scale bars, 300 μm.
Fig. 4:
Fig. 4:. Optimized EB and organoid formation.
a, EB formation in the presence of DMSO, Y-27632, Chroman 1 and CEPT. Human ESCs (WA09) cells were dissociated with Accutase and plated into 6-well ULA plates in E6 Medium. Representative phase-contrast images were taken at 24 h post-plating. Note that poor cell survival is typically observed when hPSCs are dissociated and plated in chemically defined E6 Medium without ROCK inhibitor (DMSO group). Scale bar, 200 μm. b, Single EBs from hESCs (WA09) were generated by plating a defined number of cells (Accutase dissociation) into AggreWell plates (5,000 cells/well) in E6 Medium. Images were taken 24 h post-plating. In the presence of DMSO the vast majority cells underwent cell death and EB formation was not observed, which is a typical outcome when hPSCs are cultured in chemically defined E6 Medium in the absence of a ROCK inhibitor. Treatment with Y-27632 supported EB formation but significant fraction of dead cells was observed surrounding the EB. Note that CEPT enables superior EB formation. Scale bar, 100 μm. c, Quantification of the diameter of single EBs (24 h post-plating). Data are mean ± s.d. (n = 20 EBs for Y-27632 and 22 for CEPT), ****p < 0.0001, unpaired two-tailed Student’s t-test. d, Single EB formation in 96-well ULA plates. Dissociated hESCs were plated into 96-well ULA plates at 2,000 cells/well in E6 Medium. Live and dead cells were stained (calcein green AM and PI) 24 h after cell seeding. Scale bars, 100 μm. e, Quantification of cell numbers in single EBs at day 1 and day 7 by using the CTG 3D assay. Note the significant difference between Y-27632 and CEPT treatment at both timepoints. Data represent mean ± s.d. (n = 24 EBs for each group), ****p < 0.0001 for both comparisons, one-way ANOVA. f, CEPT improves multi-lineage differentiation of single EBs. Individual EBs were cultured in 96-well ULA plates in E6 Medium to allow for spontaneous differentiation. The percentage of EBs expressing lineage-specific genes (PAX6, SOX17, Brachyury) was analyzed on day 7 using an optimized quantitative RT-PCR protocol that enabled detection of low transcript levels in single EBs. Data represent mean ± s.d. (n = 3 experiments, 24 EBs were analyzed per experiment for each group), *p = 0.0327, unpaired two-tailed Student’s t-test. g,h, Cerebral organoids were generated by administration of Y-27632 or CEPT for the first 24 h. On day 30, organoids were fixed, sectioned, processed for histology (hematoxylin and eosin stain) and immunohistochemistry for FOXG1. Representative images show that CEPT treatment resulted in larger organoids and more abundant FOXG1-expressing cells. Scale bars, 400 μm. i, RNA-seq analysis based on differentially expressed (DE) genes in day-60 organoids showing more neural-specific categories after CEPT treatment versus Y-27632. The analysis was performed by comparing top 200 DE genes in each group to 84,863 transcriptomes representing diverse human cells and tissues in the ARCHS4 datasbase. DE genes were normalized to undifferentiated hPSCs.
Fig. 5:
Fig. 5:. CEPT enables superior cryopreservation of pluripotent and differentiated cells
a-c, Cryopreserved hESCs (WA09) were thawed and plated in E8 Medium in the presence of indicated compounds. Caspase-3/7 green detection reagent was used to monitor apoptosis over 12 h (a,b) and the CTG assay was used to quantify live cells 24 h post-thawing (c). Data represent mean ± s.d. (n = 25 fields of view for each group in b; n = 12 wells for each group in c), ****p < 0.0001, one-way ANOVA. Scale bar, 50 μm. d, Variation analysis of experiments shown in e-g reveals that the thawing process is most critical for improving cell survival, whereas the use of mFreSR, Y-27632, or CEPT during cryopreservation yields similar results. Hence, the total variation for cryopreservation was 7%, while thawing accounted for 88% variation across groups. Source of variance values associated with cryopreservation and thawing processes from two-way ANOVA analysis (Fig. 5e-g) were compared by unpaired two-tailed Student’s t-test (n = 5 cell lines, ****p < 0.0001). Data is presented as mean ± s.d. e-g, Different reagents and combinations were used for cryopreservation (mFreSR, Y-27632, CEPT) and thawing (DMSO, Y-27632, CEPT, RevitaCell, CloneR, SMC4) of two hESC lines and three iPSC lines. The recovery of cryopreserved cells was quantified by live and dead cell staining with calcein green AM and PI. Data is presented as mean ± s.d. n = 3 wells per combination of treatments. Note that CEPT is consistently superior during the cell thawing process compared to other reagents across all cell lines tested. h, Frozen vials of iPSC-derived cardiomyocytes, hepatocytes, astrocytes, and motor neurons were thawed and treated with DMSO, Y-27632, and CEPT for 24 h. Cell survival was quantified using the CTG assay. Data are mean ± s.d. (n = 3 wells for each group), Cardiomyocytes, **p = 0.0047; Hepatocytes, ***p = 0.0008; Astrocytes, **p = 0.0021; Motor neurons, **p = 0.0019; one-way ANOVA. i-k, Electrophysiological characterization of iPSC-derived cardiomyocytes 5 days post-thawing using multi-electrode arrays. Data in j represent mean ± s.d. (n = 6 wells for each group), **p = 0.0029, ***p = 0.0001, one-way ANOVA. Data in k represent mean ± s.d. (n = 6 wells for each group), *p = 0.0165, ***p = 0.0005, one-way ANOVA.
Fig. 6:
Fig. 6:. CEPT protects dissociated hPSCs from multiple cellular stress mechanisms
a, Confocal microscopic analysis of Lamin B1-GFP reporter cell line displaying dramatic morphological differences in nuclear shape during cell passaging (30 min post-plating). Note the abnormal nuclear morphology of cells undergoing contractions in the presence of DMSO. Although Y-27632 inhibits cell contractions and nuclear morphologies appear more normal, furrow-like constrictions (white arrowheads) indicate that nuclei are affected by ongoing physical stress. In contrast, cells exposed to CEPT maintain normal circular nuclei. Scale bar, 10 μm. b, OCT4 expressing cells were immunoreactive for γH2AX when exposed to DMSO and Y-27632 (red arrowheads) but not when treated with CEPT (3 h post-plating). Scale bar, 10 μm. c, Dramatic cytoskeletal differences during cell passaging (3 h post-plating) as measured by immunocytochemistry against actin and myosin. Stressed cells show blebbing (white arrowheads) in the presence of DMSO or form prominent actin stress fibers at the colony edge when exposed to Y-27632 (white arrowheads). Note the normal morphology and cell attachment in the presence of CEPT. Scale bar, 10 μm. d, Confocal analysis of an iPSC GFP reporter cell line visualizing the tight junction protein TJP1 (ZO-1) before passaging and after cell dissociation. Representative images were taken 3 h post-plating for DMSO, Y-27632, and CEPT. Note the dramatic differences across treatment groups and better recovery of dissociated cells when treated with CEPT. Scale bar, 10 μm. e, Western blot analysis of hESCs (WA09) treated with Y-27632 or CEPT. Several membrane-associated proteins were expressed at higher levels after CEPT treatment (24 h post-plating). Similar results were obtained with iPSCs (see Extended Data Fig. 10b). f, Western blot analysis of hESCs (WA09) showing strong stress response in cells treated with DMSO or Y-27632 (3 h post-passage). Note the absence of γH2AX and ATF4 in CEPT-treated cells resembling the control group (no passage). Similar results were obtained with iPSCs (see Extended Data Fig. 10a). g, Puromycin pulse-chase experiment of hESCs (WA09) demonstrates that protein synthesis was strongly impaired during cell passaging and can be rescued by CEPT (3 h post-passage). See also Extended Data Fig. 10c confirming these observations using iPSCs. h, Glutathione levels were significantly higher in hESCs (WA09) passaged with CEPT (3 h post-plating). Data are mean ± s.d. (n = 4 wells for each group), ****p < 0.0001 for both comparison, one-way ANOVA. Similar results were obtained with additional two hESC and three iPSC lines (see Extended Data Fig. 10d). i, Neutral 96-well comet chip assay was carried out on three different cell lines after treatment with different reagents (6 h post-passage). Note that CEPT-treated cells always displayed the lowest amount of DNA double-strand breaks. Data are mean ± s.d. (n = 5 replicates for each group), WA09, ****p < 0.0001; LiPSC-GR1.1, ****p < 0.0001, ***p = 0.0005, *p = 0.0198; NCMR-5, ****p < 0.0001, **p = 0.0058, one-way ANOVA. j, Representative images showing comets stained with SYBR Gold and imaged by fluorescence microscopy. Comet tails were analyzed with the Comet Analysis Software (Trevigen) and correlated with the amount of DNA damage in single cells. Scale bar, 20 μm. k, Schematic summarizing the various interconnected stress mechanisms that affect cell structure and function. Comparison between stressed (DMSO or Y-27632) and cytoprotected (CEPT) cells. l, Overview of the various applications that can be optimized by using CEPT.

Comment in

References

    1. Shi Y, Inoue H, Wu JC & Yamanaka S Induced pluripotent stem cell technology: A decade of progress. Nat. Rev. Drug Discov. 16, 115–130 (2017). - PMC - PubMed
    1. Chen G et al. Chemically defined conditions for human iPSC derivation and culture. Nat. Methods 8, 424–429 (2011). - PMC - PubMed
    1. Barbaric I et al. Time-lapse analysis of human embryonic stem cells reveals multiple bottlenecks restricting colony formation and their relief upon culture adaptation. Stem Cell Reports 3, 142–155 (2014). - PMC - PubMed
    1. Chen Y & Pruett-miller SM Improving single-cell cloning work fl ow for gene editing in human pluripotent stem cells. 31, 186–192 (2018). - PubMed
    1. Ihry RJ et al. P53 inhibits CRISPR-Cas9 engineering in human pluripotent stem cells. Nat. Med. 24, 939–946 (2018). - PubMed

Publication types

MeSH terms

Substances