

Factors associated with COVID-19 related hospitalisation, critical care admission and mortality using linked primary and secondary care data
- PMID: 33942510
- PMCID: PMC8242436
- DOI: 10.1111/irv.12864
Factors associated with COVID-19 related hospitalisation, critical care admission and mortality using linked primary and secondary care data
Abstract
Background: It is important that population cohorts at increased risk of hospitalisation and death following a COVID-19 infection are identified and protected.
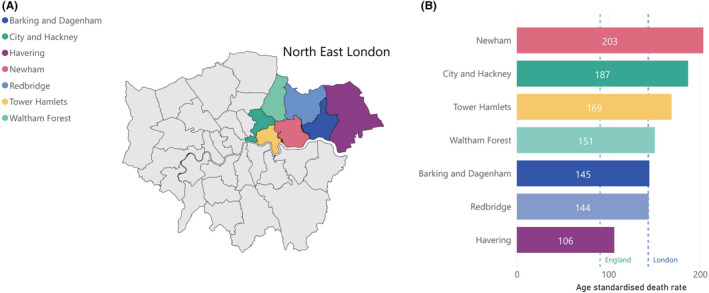
Objectives: We identified risk factors associated with increased risk of hospitalisation, intensive care unit (ICU) admission and mortality in inner North East London (NEL) during the first UK COVID-19 wave.
Methods: Multivariate logistic regression analysis on linked primary and secondary care data from people aged 16 or older with confirmed COVID-19 infection between 01/02/2020 and 30/06/2020 determined odds ratios (OR), 95% confidence intervals (CI) and P-values for the association between demographic, deprivation and clinical factors with COVID-19 hospitalisation, ICU admission and mortality.
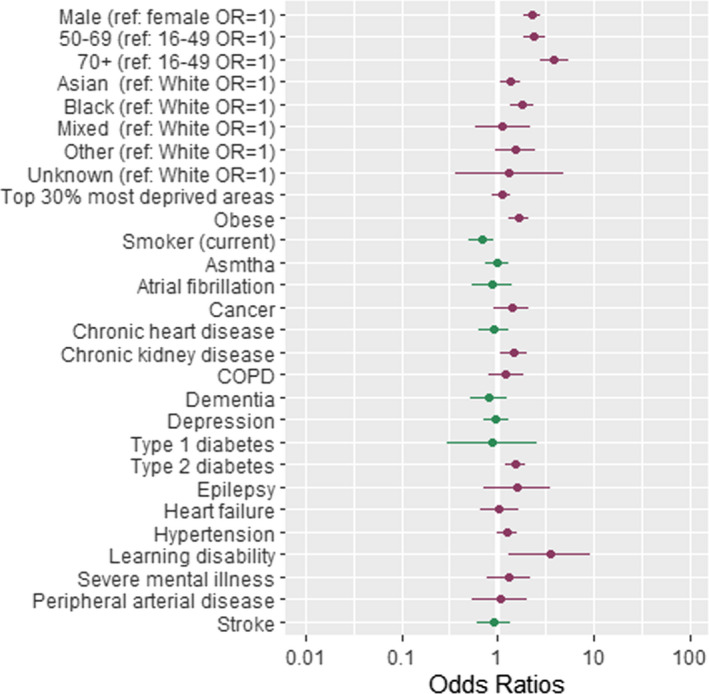
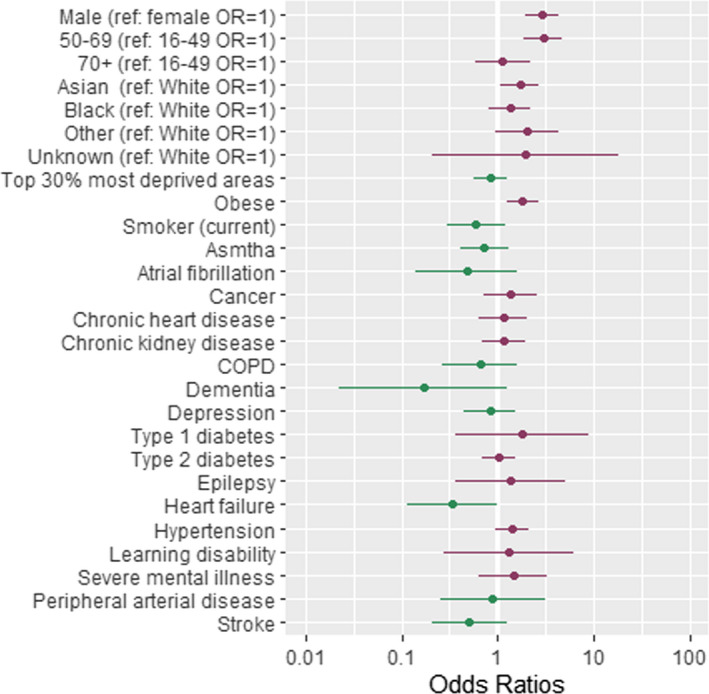
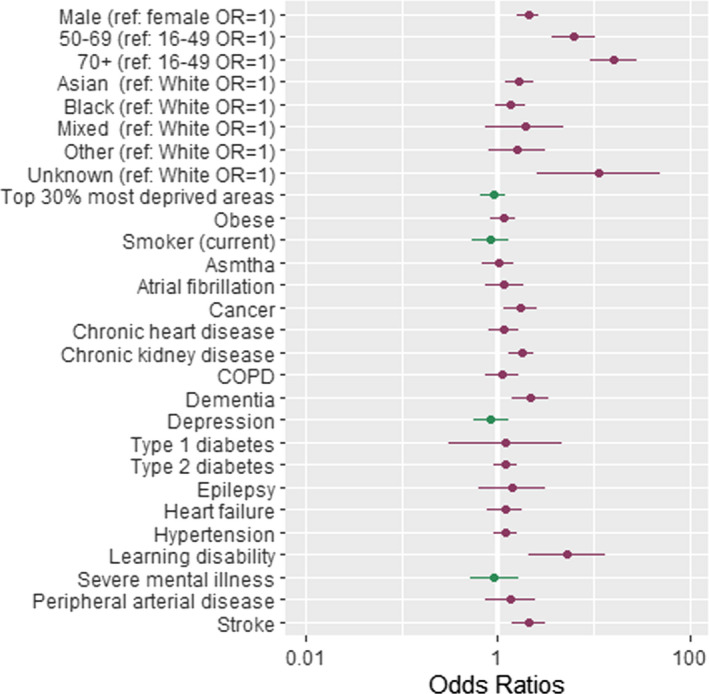
Results: Over the study period, 1781 people were diagnosed with COVID-19, of whom 1195 (67%) were hospitalised, 152 (9%) admitted to ICU and 400 (23%) died. Results confirm previously identified risk factors: being male, or of Black or Asian ethnicity, or aged over 50. Obesity, type 2 diabetes and chronic kidney disease (CKD) increased the risk of hospitalisation. Obesity increased the risk of being admitted to ICU. Underlying CKD, stroke and dementia increased the risk of death. Having learning disabilities was strongly associated with increased risk of death (OR = 4.75, 95% CI = [1.91, 11.84], P = .001). Having three or four co-morbidities increased the risk of hospitalisation (OR = 2.34, 95% CI = [1.55, 3.54], P < .001; OR = 2.40, 95% CI = [1.55, 3.73], P < .001 respectively) and death (OR = 2.61, 95% CI = [1.59, 4.28], P < .001; OR = 4.07, 95% CI = [2.48, 6.69], P < .001 respectively).
Conclusions: We confirm that age, sex, ethnicity, obesity, CKD and diabetes are important determinants of risk of COVID-19 hospitalisation or death. For the first time, we also identify people with learning disabilities and multi-morbidity as additional patient cohorts that need to be actively protected during COVID-19 waves.
Keywords: COVID-19; COVID-19 mortality risk factors; regression analysis; risk factors for COVID-19 hospitalisation.
© 2021 The Authors. Influenza and Other Respiratory Viruses published by John Wiley & Sons Ltd.
Conflict of interest statement
We declare no competing interests.
Figures
References
-
- European Centre for Disease Prevention and Control . COVID‐19 situation update worldwide, as of 17 September 2020 [Internet]. 2020. Cited 2020 Nov 4. Available from: https://www.ecdc.europa.eu/en/geographical‐distribution‐2019‐ncov‐cases
-
- UK Government . Coronavirus in the UK [Internet]. 2020. Cited 2020 Nov 5. Available from: https://coronavirus.data.gov.uk/
Publication types
MeSH terms
Grants and funding
LinkOut - more resources
Full Text Sources
Other Literature Sources
Medical
