. 2021 Jul 29;38(8):3046-3059.
doi: 10.1093/molbev/msab118.

An Evolutionary Portrait of the Progenitor SARS-CoV-2 and Its Dominant Offshoots in COVID-19 Pandemic

Affiliations

An Evolutionary Portrait of the Progenitor SARS-CoV-2 and Its Dominant Offshoots in COVID-19 Pandemic

Sudhir Kumar et al. Mol Biol Evol. .

Abstract

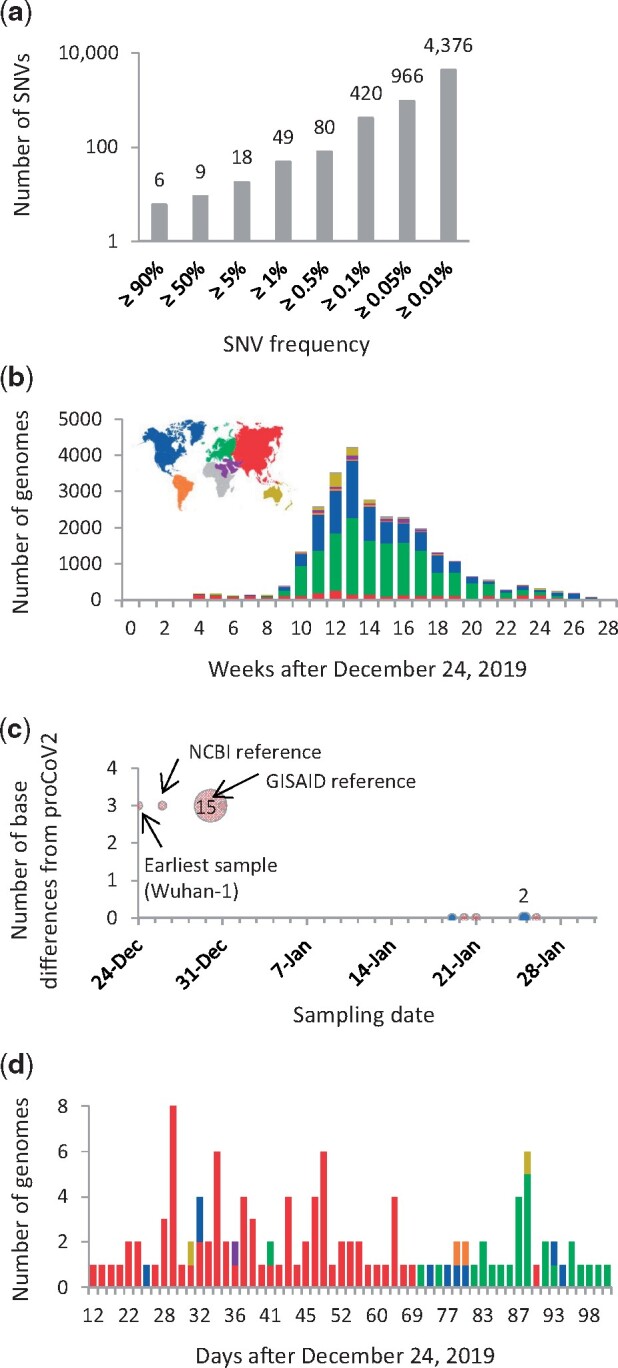
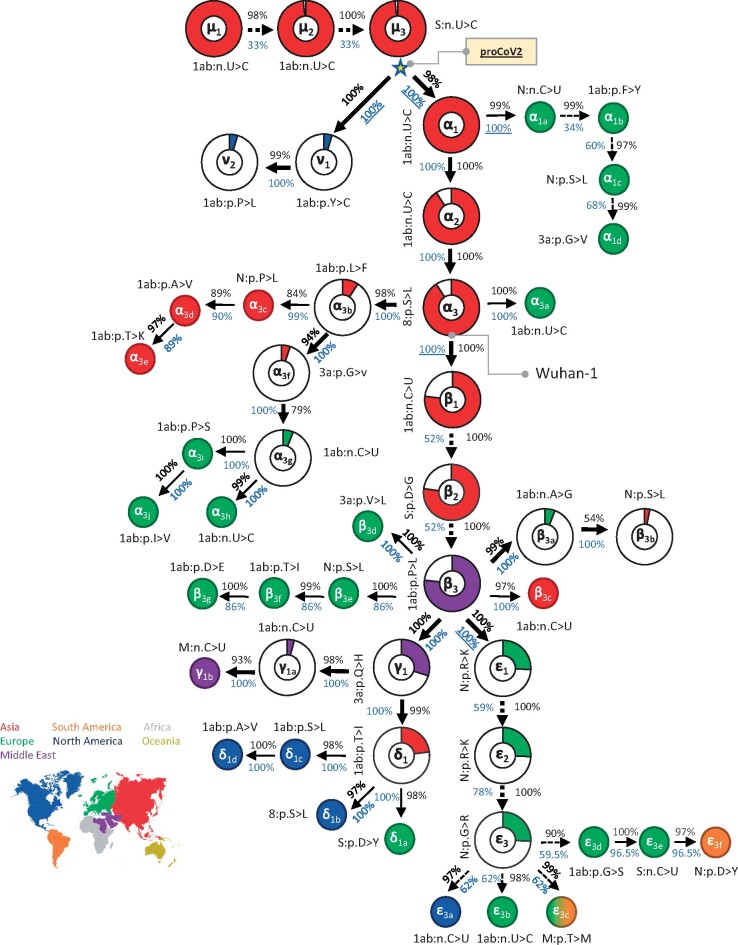
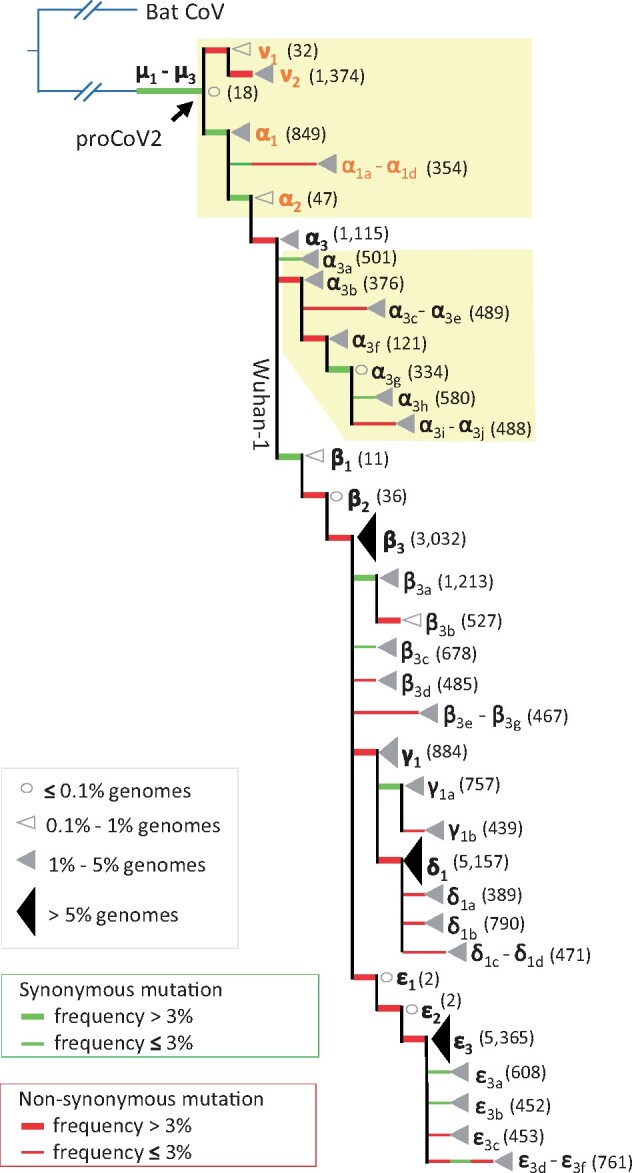
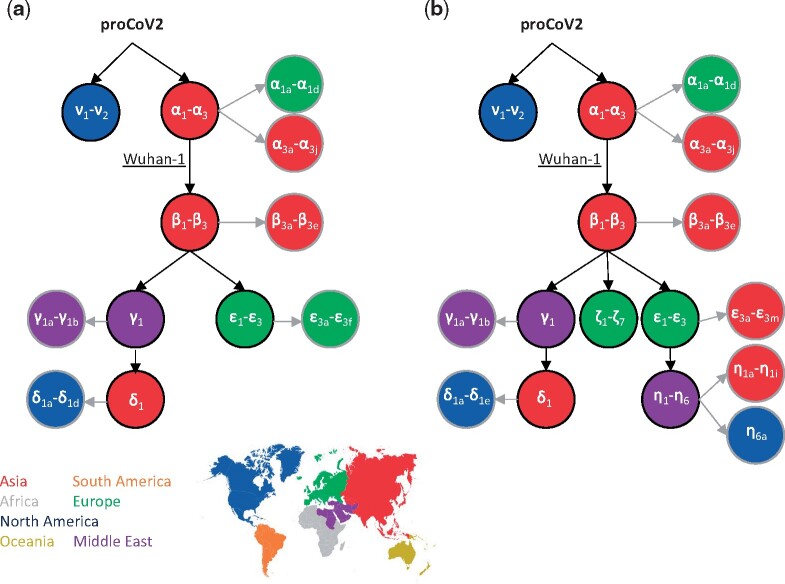
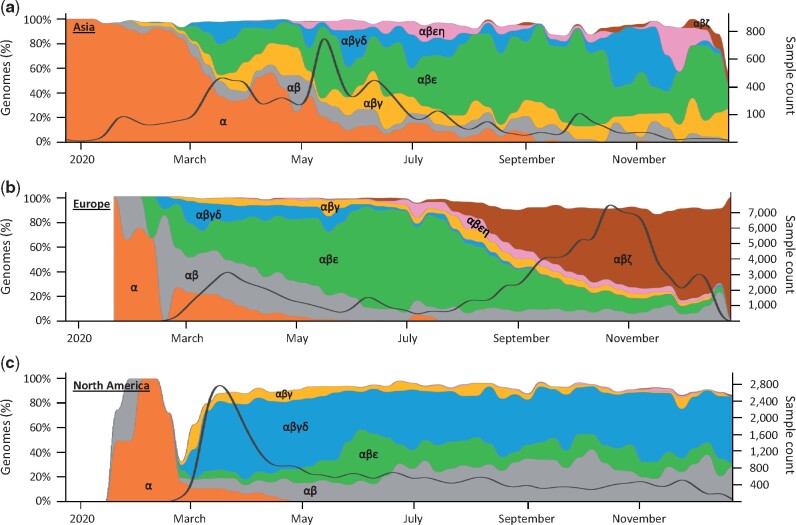
Global sequencing of genomes of severe acute respiratory syndrome coronavirus 2 (SARS-CoV-2) has continued to reveal new genetic variants that are the key to unraveling its early evolutionary history and tracking its global spread over time. Here we present the heretofore cryptic mutational history and spatiotemporal dynamics of SARS-CoV-2 from an analysis of thousands of high-quality genomes. We report the likely most recent common ancestor of SARS-CoV-2, reconstructed through a novel application and advancement of computational methods initially developed to infer the mutational history of tumor cells in a patient. This progenitor genome differs from genomes of the first coronaviruses sampled in China by three variants, implying that none of the earliest patients represent the index case or gave rise to all the human infections. However, multiple coronavirus infections in China and the United States harbored the progenitor genetic fingerprint in January 2020 and later, suggesting that the progenitor was spreading worldwide months before and after the first reported cases of COVID-19 in China. Mutations of the progenitor and its offshoots have produced many dominant coronavirus strains that have spread episodically over time. Fingerprinting based on common mutations reveals that the same coronavirus lineage has dominated North America for most of the pandemic in 2020. There have been multiple replacements of predominant coronavirus strains in Europe and Asia as well as continued presence of multiple high-frequency strains in Asia and North America. We have developed a continually updating dashboard of global evolution and spatiotemporal trends of SARS-CoV-2 spread (http://sars2evo.datamonkey.org/).

Keywords: coronavirus; phylogeny; web tool.


Figures

Fig. 1
Fig. 1
Counts of SNVs and genomes in the 29KG data set. (a) Cumulative count of SNVs presented in the 29KG genome data set at different frequencies. (b) The number of genomes in the 29KG collection that were isolated weekly during the pandemic. (c) The number of base differences from proCoV2 (see fig. 2) for genomes sampled in December 2019 and January 2020. The 18 genomes sampled in December 2019 in China (red) have three common SNVs different from proCoV2. In contrast, six genomes sampled in January 2020 in China (Asia, red) and the United States (North America, blue) show no base differences. Multiple genomes (2 and 15) were sampled on two different days. (d) Temporal and spatial distribution of strains identical to proCoV2 at the protein sequence level, that is, they have only μ mutations. The color scheme used to mark sampling locations is shown in panel b.
Fig. 2.
Fig. 2.
Mutational history graph of SARS-CoV-2 from the 29KG data set. Thick arrows mark the pathway of widespread variants (frequency, vf ≥ 3%), and thin arrows show paths leading to other common mutations (3% > vf > 1%). The pie-chart sizes are proportional to variant frequencies in the 29KG data set, with pie-charts shown for variants with vf > 3% and pie color based on the world’s region where that mutation was first observed. A circle is used for all other variants, with the filled color corresponding to the earliest sampling region. The COI (black font) and the BCL (blue font) of each mutation and its predecessor mutation are shown next to the arrow connecting them. Underlined BCL values mark variant pairs for which BCLs were estimated for groups of variants (see Materials and Methods) because of the episodic nature of variant accumulation within groups resulting in lower BCLs (<80%, dashed arrows). Base changes (n.) are shown for synonymous mutations, and amino acid changes (p.) are shown for nonsynonymous mutations along with the gene/protein names (“ORF” is omitted from gene name abbreviations given in table 1). More details on each mutation are presented in table 1.
Fig. 3.
Fig. 3.
A waterfall display of genome phylogeny recapitulating the mutation history in figure 2. The numbers of genomes mapped to each node are depicted by open circles (very few genomes), open triangles (few genomes), small gray triangles (many genomes), and large black triangles (very many genomes). The actual number of genomes is given in the parenthesis. The tip label is the name of the mutation on the connecting branch. Green and red branches are synonymous and nonsynonymous mutations, respectively. Thick branches mark mutations that occur with a frequency >3% in the 29KG data set. The yellow background highlights the diversity of coronavirus lineages that evolved from the genomes leading to Wuhan-1 coronavirus.
Fig. 4.
Fig. 4.
The backbone of SARS-CoV-2 mutational history. The mutational history inferred was from (a) 29KG and (b) 68KG data sets. Major variants and their mutational pathways are shown in black, and minor variants and their mutational pathways are shown in gray. Circle color marks the region where variants were sampled first. The 68KG data set contains 12 additional variants and more than two times the genomes than the 29KG data set.
Fig. 5.
Fig. 5.
Spatiotemporal dynamics of 172,480 SARS-CoV-2 genomes (December 2019–2020). Spatiotemporal patterns of genomes mapped to lineages containing different combinations of major variants in (a) Asia, (b) Europe, and (c) North America. The number of genomes mapped to major variant lineages contains all of its offshoots, for example, α lineage contains all the genomes with α1–α3, α1a–α1d, and α3a–α3j variants only. The stacked graph area is the proportion of genomes mapped to the corresponding lineage. The solid black line shows the count of total genome samples. Spatiotemporal patterns in cities, countries, and other regions are available online at http://sars2evo.datamonkey.org/ (last accessed on March 28, 2021).

Update of

References

    1. Amendola A, Bianchi S, Gori M, Colzani D, Canuti M, Borghi E, Raviglione MC, Zuccotti GV, Tanzi E. 2021. Evidence of SARS-CoV-2 RNA in an Oropharyngeal Swab Specimen, Milan, Italy, early December 2019. Emerg Infect Dis. 27(2):648–650. - PMC - PubMed
    1. Andersen KG, Rambaut A, Lipkin WI, Holmes EC, Garry RF.. 2020. The proximal origin of SARS-CoV-2. Nat Med. 26(4):450–452. - PMC - PubMed
    1. Boni MF, Lemey P, Jiang X, Lam TTY, Perry BW, Castoe TA, Rambaut A, Robertson DL.. 2020. Evolutionary origins of the SARS-CoV-2 sarbecovirus lineage responsible for the COVID-19 pandemic. Nat Microbiol. 5(11):1408–1417. - PubMed
    1. Casals F, Bertranpetit J.. 2012. Human genetic variation, shared and private. Science 337(6090):39–40. - PubMed
    1. Castells M, Lopez-Tort F, Colina R, Cristina J.. 2020. Evidence of increasing diversification of emerging SARS-CoV-2 strains. J Med Virol. 92(10):2165–2172. - PMC - PubMed

Publication types