. 2021 Jul 5;218(7):e20201793.
doi: 10.1084/jem.20201793. Epub 2021 May 4.

A positive feedback loop reinforces the allergic immune response in human peanut allergy

Affiliations

A positive feedback loop reinforces the allergic immune response in human peanut allergy

Xiaoying Zhou et al. J Exp Med. .

Abstract

Food allergies are a leading cause of anaphylaxis, and cellular mechanisms involving antigen presentation likely play key roles in their pathogenesis. However, little is known about the response of specific antigen-presenting cell (APC) subsets to food allergens in the setting of food allergies. Here, we show that in peanut-allergic humans, peanut allergen drives the differentiation of CD209+ monocyte-derived dendritic cells (DCs) and CD23+ (FcєRII) myeloid dendritic cells through the action of allergen-specific CD4+ T cells. CD209+ DCs act reciprocally on the same peanut-specific CD4+ T cell population to reinforce Th2 cytokine expression in a positive feedback loop, which may explain the persistence of established food allergy. In support of this novel model, we show clinically that the initiation of oral immunotherapy (OIT) in peanut-allergic patients is associated with a decrease in CD209+ DCs, suggesting that breaking the cycle of positive feedback is associated with therapeutic effect.


Conflict of interest statement

Disclosures: E.D. Mellins reported grants from Glaxo-Smith-Kline and Novartis outside the submitted work. K.C. Nadeau reported grants from the National Institute of Allergy and Infectious Diseases, the National Heart, Lung, and Blood Institute, the National Institute of Environmental Health Sciences, and Food Allergy Research and Education; "other" from World Allergy Organization, Cour Pharma, Before Brands, Alladapt, Latitude, IgGenix, Immune Tolerance Network, and the National Institutes of Health clinical research centers outside the submitted work. In addition, K.C. Nadeau had a patent to "inhibition of allergic reaction to peanut allergen using an IL-33 inhibitor" (US patent no. 62/647,389, filed 3/23/2018), a patent to "special oral formula for decreasing food allergy risk and treatment for food allergy (US patent no. 62/119,014, filed 2/20/15, issued 8/15/17) issued, a patent to "basophil activation-based diagnostic allergy test" (US application no. S10-392, filed 10/1/2010), a patent to "granulocyte-based methods for detecting and monitoring immune system disorders" (US application no. 12/686,121, filed 1/12/2010), a patent to "methods and assays for detecting and quantifying pure subpopulations of white blood cells in immune system disorders" (US patent no. 12/610,940, filed 11/2/2009, issued 8/12/2018), a patent to "mixed allergen compositions and methods for using the same" (US patent no. 10/064,936, issued 9/4/2018), and a patent to "microfluidic device and diagnostic methods for allergy testing based on detection of basophil activation" (US patent no. 62/767,444, filed 11/14/2018). No other disclosures were reported.

Figures
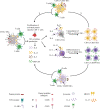
Figure 1.
Figure 1.
A positive feedback loop between the adaptive and innate immune systems in food allergy. Allergen exposure induces antigen-specific CD4+ T cells to secrete IL-4 and IL-13 in food-allergic patients. These Th2 cytokines drive the differentiation of monocytes into CD209+ MDDCs and the up-regulation CD23 on myeloid CD11c+ DCs. This in turn facilitates the uptake and HLA presentation of allergen, reinforcing the adaptive immune response to allergen.
Figure 2.
Figure 2.
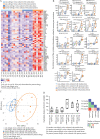
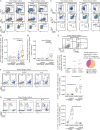
PBMCs from PA individuals secrete a distinct cytokine profile after stimulation with peanut protein. (A) Heatmap of secretion levels of 62 cytokines measured by Luminex-based 62-multiplex assay from PBMCs stimulated with or without peanut protein for six pairs of peanut allergy–discordant twins. Each column represents PBMCs from the indicated twin sibling cultured with medium alone or with peanut protein. Red and blue indicate higher and lower expression, respectively. Colored bars at the top of the heatmap indicate peanut allergy status and culture conditions for each experimental group. (B) Secreted levels of 14 cytokines related to monocyte activation from PBMCs stimulated with or without peanut protein for six pairs of peanut allergy–discordant twins. Each pair of points connected by a line represents a sample from one sibling twin. Box plots indicate the interquartile range (IQR) and median; whiskers extend to the farthest data point within a maximum of 1.5× IQR. Sets of paired samples were analyzed using the Wilcoxon signed rank test (two sided). Unpaired sample sets were analyzed using the Wilcoxon rank sum test (two sided). P values were adjusted for multiple comparisons using the Benjamini and Hochberg approach to control the FDR. FDR-adjusted P values <0.1 were considered significant. (C) Unsupervised PCA of 14 cytokines related to monocyte activation for six pairs of peanut allergy–discordant twins. The percentage variances explained by principal component 1 (PC1) and PC2 are indicated. (D) Euclidean distances computed based on 14 cytokines related to monocyte activation for six pairs of peanut allergy–discordant twins. Box plots overlaid with dot plots represent the Euclidean distances calculated pairwise either between samples from same person cultured under different conditions or between samples from twin siblings, depending on the experimental group (six pairs for each group; left); heatmap represents the median values of the distances between each group (right).
Figure S1.
Figure S1.
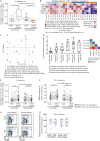
No change in total live cell number when PBMCs are incubated with or without peanut protein for 3 d or when the subjects are NA or PA and the immune cell subsets are identified using unsupervised FlowSOM-based clustering analysis. (A) The number of total live PBMCs stimulated with or without peanut protein in NA and PA participants. Blue circles represent samples from twin participants (n = 6 for each group); open circles represent the samples from nontwin participants (NA, n = 20; PA, n = 16). Each pair of points connected by a line represents one subject. Box plots represent the interquartile range (IQR) and median; whiskers extend to the farthest data point within a maximum of 1.5× IQR. Paired sample sets were analyzed using the Wilcoxon signed rank test (two sided). Unpaired sample sets were analyzed using the Wilcoxon rank sum test (two sided). (B) In each sample, 50,000 cells of the pregated live, single cells were randomly selected, and the marker expression values were inverse hyperbolic sine (Arcsinh)-transformed with a cofactor of 5. Heatmap representing the median expression levels of the marker in each cluster. 12 cell types were identified based on expression levels of markers in each cluster. (C) UMAP representation of 12,000 randomly selected cells (500 per file) with the identified cell types from the FlowSOM analysis.
Figure S2.
Figure S2.
Mass cytometric gating strategies for monocytes and CD11c+ DCs. Incubation with peanut protein decreases the expression of CD86 and HLA-DR on monocytes for PA participants, increases CD86 and HLA-DR expression by LinCD14CD16HLA-DR+ cells for both NA and PA participants, and increases the percentage of CD11c+ DCs for both NA and PA participants. (A) Mass cytometric plots showing the gating strategies for monocytes and CD11c+ DCs. (B and C) The expression of CD86 (B) and HLA-DR (C) on monocytes from the PBMCs stimulated with or without peanut protein in NA and PA participants. (D–F) The expression of CD86 (D) and HLA-DR (E) on Lin (CD3, CD19, CD56, CD123)HLA-DR+CD14CD16 cells and the percentage of CD11c+ DCs in PBMCs (C) in NA and PA participants stimulated with or without peanut protein. Box plots represent the interquartile range (IQR) and median; whiskers extend to the farthest data point within a maximum of 1.5× IQR. Blue circles represent samples from twin participants (n = 6 for each group); open circles represent the samples from nontwin participants (NA, n = 20; PA, n = 16). Each pair of points connected by a line represents one subject. Paired sample sets were analyzed using the Wilcoxon signed rank test (two sided). Unpaired sample sets were analyzed using the Wilcoxon rank sum test (two sided). *, P < 0.05; **, P < 0.01; ***, P < 0.001.
Figure 3.
Figure 3.
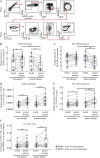
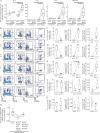
Changes in monocyte frequency and surface markers are associated with the allergen stimulation of PBMCs from PA children. (A) Monocyte percentages among PBMCs from six pairs of twin siblings discordant for peanut allergy. Each colored dot represents a single twin sample according to allergic status and culture conditions. (B) Heatmap representing median expression levels for CD14, CD16, CD86, HLA-DR, and CD11c on monocytes gated from PBMCs stimulated with or without peanut protein for six pairs of peanut allergy–discordant twins. Each column represents PBMCs from the indicated twin sibling cultured with medium alone or with peanut protein. Each row represents the normalized median expression using z-scores. Red and blue indicate higher and lower expression, respectively. Colored bars at the top of the heatmap indicate peanut allergy status and culture conditions for each experimental group. (C) PCA of five monocyte-related markers for six peanut allergy–discordant twin pairs. The percentage variances explained by principal component 1 (PC1) and PC2 are shown. Each point represents a single twin sample color-coded according to allergic status and peanut protein stimulation status. (D) Euclidean distances computed based on five monocyte-related markers for six pairs of peanut allergy–discordant twins. Box plots overlaid with dot plots represent the Euclidean distances for each pair of twin samples per each group (left), and the median values of distance for each group are displayed in a heatmap (right). (E and F) The percentage of monocytes among total PBMCs (E) and the median expression of CD14 on monocytes (F) from NA and PA samples stimulated with or without peanut protein. Blue circles represent samples from twin participants (n = 6 for each group); open circles represent the samples from nontwin participants (NA, n = 20; PA, n = 16). (G and H) Controls for the peanut allergen–specific down-regulation of CD14 expression on monocytes from PA subjects. Monocyte CD14 expression remained unchanged following PBMC incubation with cow’s milk for both PA and NA individuals who were not allergic to milk. Representative flow cytometry plots showing the monocyte population from PBMCs incubated with or without milk for one NA and one PA participant, neither allergic to milk (G). Monocyte CD14 expression after incubating PBMCs with or without milk for six NA and six PA participants who were not allergic to milk (H). Box plots in A, E, F, and H represent the interquartile range (IQR) and median; whiskers extend to the farthest data point within a maximum of 1.5× IQR. Paired sample sets were analyzed using the Wilcoxon signed rank test (two sided). Each pair of points connected by a line represents one subject. Unpaired sample sets were analyzed using the Wilcoxon rank sum test (two sided). *, P < 0.05; ***, P < 0.001.
Figure 4.
Figure 4.
Peanut allergen promotes monocyte differentiation into CD209+ DCs in peanut allergy. (A) Representative flow cytometry plots gated on lineage (CD3, CD19, CD56) negative (Lin) HLA-DR+ cells show the effect of peanut protein on CD209+CD11c+ and CD209CD11c+ DCs for one NA and one PA nontwin participant. The frequencies of the gated populations are shown. (B and C) Percentage of CD209+CD11c+ DCs per total PBMCs or per CD11c+ DCs (B) and percentage of CD209CD11c+ DCs per total PBMCs (C) are shown in box plots overlaid with dot plots from six NA and six PA nontwin participants. (D) Tracking monocyte differentiation by CFSE labeling. Representative flow cytometry plots gated on Lin cells show the effect of peanut protein on CFSE+ monocytes and CFSE+CD209+CD11c+ DCs for one PA nontwin participant. (E) The percentage of CFSE+ monocytes per LinCFSE+ cells (left) and their absolute number (right) per 106 cultured cells are shown in box plots overlaid with dot plots for seven PA nontwin participants. (F) The percentage of CFSE+CD209+CD11c+ DCs per LinCFSE+ cells (left) or per LinCFSE+CD11c+ DCs (middle), as well as the absolute number of CFSE+CD209+CD11c+ DCs (right) per 106 cultured cells, are shown in box plots overlaid with dot plots for seven PA nontwin participants. Box plots in B, C, E, and F represent IQR and median; whiskers extend to the farthest data point within a maximum of 1.5× IQR. Each pair of points connected by a line represents one subject. Paired sample sets were analyzed using the Wilcoxon signed rank test (two sided). Unpaired sample sets were analyzed using the Wilcoxon rank sum test (two sided). *, P < 0.05; **, P < 0.01.
Figure S3.
Figure S3.
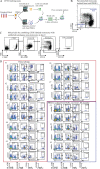
Schematic overview and flow cytometry plots showing the CFSE-based assay for tracking monocyte changes in response to peanut protein for PA subjects. (A) Schematic overview of the CFSE-based monocyte tracking assay. (B) Representative flow cytometry plots showing the purity of isolated untouched monocytes using Miltenyi pan monocytes isolation kit. (C) Representative flow cytometry plots show the CFSE+CD209+CD11c+ DCs in the mixed cells by combining CFSE-labeled monocytes and unlabeled autologous nonmonocytes before incubation with peanut proteins. (D) Flow cytometry plots gated on Lin (CD3, CD19, CD56) negative cells show the change of CFSE+ monocytes and CFSE+CD209+CD11c+ DCs by peanut protein from the PBMCs stimulated with or without peanut protein in seven PA participants and three healthy buffy coats.
Figure 5.
Figure 5.
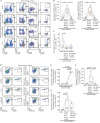
Peanut allergen augments CD23 expression on myeloid CD11c+ DCs. (A) Representative flow cytometry plots gated on lineage (CD3, CD19, CD56) negative (Lin) HLA-DR+ cells show the effect of peanut protein on CD14CD16CD23+CD11c+ DCs for one NA and one PA nontwin participant. (B) Box plots overlaid with dot plots show the percentage of CD23+CD11c+ DCs per total PBMCs from five NA and nine PA nontwin participants with or without peanut stimulation. (C) Representative mass cytometry plots gated on lineage (CD3, CD19, CD56, CD123) negative (Lin) HLA-DR+ cells show the effect of peanut protein on CD14CD16CD23+CD11c+ DCs for one NA and one PA nontwin participant. (D) Percentage CD23+CD11c+ DCs per total PBMCs incubated with or without peanut protein are shown in box plots overlaid with dot plots for five NA and five PA nontwin participants. (E) Top: Representative flow cytometry plots showing the effect of peanut protein on the expression of CD23 and CD209 by LinHLA-DR+CD14CD16CD11c+ DCs from one PA nontwin participant. The frequencies of the gated populations are shown. Bottom left: Distribution of CD209 and CD23 expression among CD11c+ DCs that expressed one or both markers. Bottom right: Among CD11c+ DCs that expressed CD209 and/or CD23, pie charts showing the average proportion of cells expressing one or the other marker. PBMCs from PA individuals were incubated with peanut protein (n = 9). (F and G) Left: Representative flow cytometry plots gated on LinHLA-DR+CD14CD16CD11c+ DCs show the expression of CD23 (F) or CD209 (G) on CFSE or CFSE+ cells for one PA nontwin participant. The cells from the same subject stimulated with IL-4 for 3 d are evaluated as the positive control for the expression of CD23 or CD209 on CFSE+ or CFSE cells. Right: Percentage of CD23+ (F) or CD209+ (G) DCs segregated by CFSE staining for four PA nontwin participants. Box plots in B, D, F, and G represent IQR and median; whiskers extend to the farthest data point within a maximum of 1.5× IQR. Paired sample sets were analyzed using the Wilcoxon signed rank test (two sided). Each pair of points connected by a line represents one subject. Unpaired sample sets were analyzed using the Wilcoxon rank sum test (two sided). *, P < 0.05; **, P < 0.01.
Figure S4.
Figure S4.
CD23+CD11c+ DCs are induced by peanut protein in PA, but not NA, participants. Mass cytometry plots gated on Lin (CD3, CD19, CD56, CD123)HLA-DR+CD14CD16 cells showing the change of CD23+CD11c+ DCs by peanut protein for five NA and five PA nontwin participants.
Figure S5.
Figure S5.
Th2 cytokines promote monocyte differentiation into CD209+ DCs, and blocking GM-CSF partially reverses the decrease in monocyte frequency induced by peanut protein in PA participants. (A) The expression levels of secreted Th2 cytokines from the PBMCs cultured with or without peanut protein from six pairs of discordant twin siblings for peanut allergy. Each dot represents a single participant, colored according to different treatment. Each pair of points connected by a line represents one subject. (B) Representative flow cytometry plots gated on lineage (CD3, CD19, CD56) negative cells show the change of CFSE+ monocytes and CFSE+CD209+CD11C+ DCs by IL-4, IL-13, IL-5, GM-CSF, or IL4 + GM-CSF from buffy coats. (C–G) Percentages of CFSE+ monocytes in LinCFSE+ cells (left) and of CFSE+CD209+CD11c+ DCs in LinCFSE+ cells (middle) or in CFSE+CD11c+ DCs (right) from the PBMCs treated with IL-4 (C), IL-13 (D), IL4 + GM-CSF (E), GM-CSF (F), or IL-5 (G) from three buffy coats. (H) Percentages of monocytes in PBMCs are shown in box plots overlaid with dot plots from five PA participants treated with peanut protein + anti-GM-CSF antibody and peanut protein + isotype control for anti-GM-CSF antibody (mouse IgG1). Box plots in A and C–H represent the interquartile range (IQR) and median; whiskers extend to the farthest data point within a maximum of 1.5× IQR. Each pair of points connected by a line represents one subject. Paired sample sets were analyzed using the Wilcoxon signed rank test (two sided). Unpaired sample sets were analyzed using the Wilcoxon rank sum test (two sided). *, P < 0.05; **, P < 0.01.
Figure 6.
Figure 6.
Signaling through IL4RA is responsible for the expression of CD209 and CD23 by DCs after peanut allergen stimulation. (A) Representative flow cytometry plots gated on Lin cells show the effect of peanut protein, anti-IL4RA blocking antibody, and IL-4 on CFSE-labeled monocytes and CD209+CD11c+ DCs for one PA nontwin participant. (B and C) The percentage of CFSE+CD209+CD11c+ DCs per LinCFSE+ cells (B, left) or LinCFSE+CD11c+ DCs (B, right), as well as the percentage of CFSE+ monocytes per LinCFSE+ cells (C), are shown for seven PA nontwin participants. (D) Representative mass cytometry plots gated on LinHLA-DR+CD14CD16 cells show the effects of peanut protein, IL-4, GM-CSF, and blocking antibodies to IL-4 or GM-CSF on CD23+CD11c+ DCs for one PA nontwin participant. (E–G) Percentages of CD23+CD11c+ DCs per total PBMCs from five PA nontwin participants treated with different combinations of peanut protein, IL-4, GM-CSF, and blocking antibodies against IL-4RA or GM-CSF. Box plots in B, C, and E–G represent IQR and median; whiskers extend to the farthest data point within a maximum of 1.5× IQR. Each pair of points connected by a line represents one subject. Paired sample sets were analyzed using the Wilcoxon signed rank test (two sided). Unpaired sample sets were analyzed using the Wilcoxon rank sum test (two sided). For the Wilcoxon signed rank comparisons, the lowest possible P value attainable for our analysis with five PA individuals is 0.0625. *, P < 0.05.
Figure 7.
Figure 7.
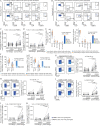
T cells are the major source of IL-4 and IL-13 responsible for monocyte and DC differentiation following peanut protein stimulation. (A and B) Representative mass cytometry plots showing CD4+ activated T cells as measured by CD25 and CD154 expression, identified by backgating from IL4+ cells (A) and IL-13+ cells (B) for one NA and one PA participant. (C and D) Percentage of IL-4+ (C) and IL-13+ (D) cells per total PBMCs incubated with or without peanut protein for NA versus PA participants. (E and F) Percentage of different cell types (T cells, B cells, natural killer cells, CD11c+ DCs, and monocytes) in IL-4+ cells (left) or IL-13+ cells (right; E). Percentage of CD4+ and CD8+ T cells in IL-4+CD3+ T cells (left) or IL-13+CD3+ T cells (right; F). Each dot represents a single subject color-coded according to allergic status and peanut protein stimulation status. NK, natural killer. (G–I) Left: Representative mass cytometry plots show the effect of peanut protein on CD4+ T cells for the expression of CD25 and IL-4 (G), IL-13 (H), or CD154 (I) for one NA and one PA participant. Right: Percentage of CD25+IL-4+ (G), CD25+IL-13+ (H), and CD25+CD154+ (I) CD4+ T cells for PBMCs from NA and PA participants incubated with or without peanut protein. (J and K) Mass cytometry backgating based on IL-4 and IL-13: Percentage of IL-4+CD25+CD154+CD4+ T cells (J) and IL-13+CD25+CD154+CD4+ T cells (K) per total PBMCs incubated with or without peanut protein for NA versus PA participants. Box plots in C, D, and G–K represent IQR and median; whiskers extend to the farthest data point within a maximum of 1.5× IQR. Blue circles represent twin participants (n = 6 for each group); open circles represent nontwin participants (NA, n = 20; PA, n = 16). Each pair of points connected by a line represents one subject. Paired sample sets were analyzed using the Wilcoxon signed rank test (two sided). Unpaired sample sets were analyzed using the Wilcoxon rank sum test (two sided). ***, P < 0.001.
Figure 8.
Figure 8.
Removing CD3+ cells from PA participants resulted in an increase in monocyte percentage and an absence of CD209+ MDDCs after peanut stimulation. (A) Flow cytometry plots showing an increase in monocyte percentage and the absence of CD209+ MDDCs following peanut stimulation of CD3-depleted PBMCs from NA and PA participants. Flow cytometry plots gated on LinHLA-DR+ cells show the effect of CD3 depletion on CD209+CD11c+ DCs for one NA and one PA nontwin participant. (B) Box plots overlaid with dot plot show the percentage of monocytes in CD3-depleted PBMCs incubated with or without peanut protein for six NA and six PA nontwin participants. (C) Absolute number of CD209+CD11c+ DCs in either whole or CD3-depleted PBMCs incubated with peanut protein for six NA and six PA nontwin participants. Box plots in B represent IQR and median, and whiskers extend to the farthest data point within a maximum of 1.5× IQR. Each pair of points connected by a line represents one subject. Paired sample sets were analyzed using the Wilcoxon signed rank test (two sided). Unpaired sample sets were analyzed using the Wilcoxon rank sum test (two sided). *, P < 0.05.
Figure 9.
Figure 9.
CD209 promotes Th2 cytokine expression by peanut-specific T cells and correlates negatively with peanut OIT. (A–C) Blocking CD209 expression in CD11c+ DCs reduces the production of Th2 cytokines (IL-4 and IL-13) from peanut-activated CD4+ T cells by peanut protein in PA participants. Representative flow cytometry plots gated on lineage (CD3, CD19, CD56) negative (Lin) HLA-DR+CD14CD16 cells show the effect of anti-CD209 blocking antibody on CD209+CD11c+ DCs for one PA nontwin participant (A). Representative flow cytometry plots gated on CD4+ T cells show the effect of anti-CD209 blocking antibody on the expression of CD25, IL-4, and IL-13 for one PA nontwin participant (B). Percentage of CD4+ T cells expressing CD25 and either IL-4 (left) or IL-13 (right) for six PA nontwin participants (C). (D–G) The induction of CD209+CD11c+ DCs and peanut-specific CD4+ T cells after 3-d incubation with peanut protein is reduced by OIT. Representative flow cytometry plots gated on lineage (CD3, CD19, CD56) negative (Lin) HLA-DR+ cells showing the effect of OIT on CD209+CD11c+ DCs for one PA participant (D). Percentage of CD209+CD11c+ DCs per total PBMCs (top) and per CD11c+ DCs (bottom) are shown for six PA participants before and during OIT (E). Representative flow cytometry plots gated on CD4+ T cells show the effect of OIT on expression of the activation markers CD25 and CD154 for one PA participant (F). Percentage of CD25+CD154+ cells per total CD4+ cells for six PA subjects before and during OIT (G). Box plots in 9, C, E, and G represent IQR and median; whiskers extend to the farthest data point within a maximum of 1.5× IQR. Each pair of points connected by a line represents one subject. Paired sample sets were analyzed using the Wilcoxon signed rank test (two sided). Unpaired sample sets were analyzed using the Wilcoxon rank sum test (two sided). *, P < 0.05.

Similar articles

Cited by

References

    1. Acharya, M., Borland G., Edkins A.L., Maclellan L.M., Matheson J., Ozanne B.W., and Cushley W.. 2010. CD23/FcεRII: molecular multi-tasking. Clin. Exp. Immunol. 162:12–23. 10.1111/j.1365-2249.2010.04210.x - DOI - PMC - PubMed
    1. Akdis, C.A. 2006. Allergy and hypersensitivity: mechanisms of allergic disease. Curr. Opin. Immunol. 18:718–726. 10.1016/j.coi.2006.09.016 - DOI - PubMed
    1. Al-Hammadi, S., Al-Maskari F., and Bernsen R.. 2010. Prevalence of food allergy among children in Al-Ain city, United Arab Emirates. Int. Arch. Allergy Immunol. 151:336–342. 10.1159/000250442 - DOI - PubMed
    1. Alonso, M.N., Wong M.T., Zhang A.L., Winer D., Suhoski M.M., Tolentino L.L., Gaitan J., Davidson M.G., Kung T.H., Galel D.M., et al. . 2011. T(H)1, T(H)2, and T(H)17 cells instruct monocytes to differentiate into specialized dendritic cell subsets. Blood. 118:3311–3320. 10.1182/blood-2011-03-341065 - DOI - PMC - PubMed
    1. Arango Duque, G., and Descoteaux A.. 2014. Macrophage cytokines: involvement in immunity and infectious diseases. Front. Immunol. 5:491. 10.3389/fimmu.2014.00491 - DOI - PMC - PubMed

Publication types

MeSH terms