. 2021 May 3;21(5):2.
doi: 10.1167/jov.21.5.2.

The virtual loss function in the summary perception of motion and its limited adjustability

Affiliations

The virtual loss function in the summary perception of motion and its limited adjustability

Tianyuan Teng et al. J Vis. .

Abstract

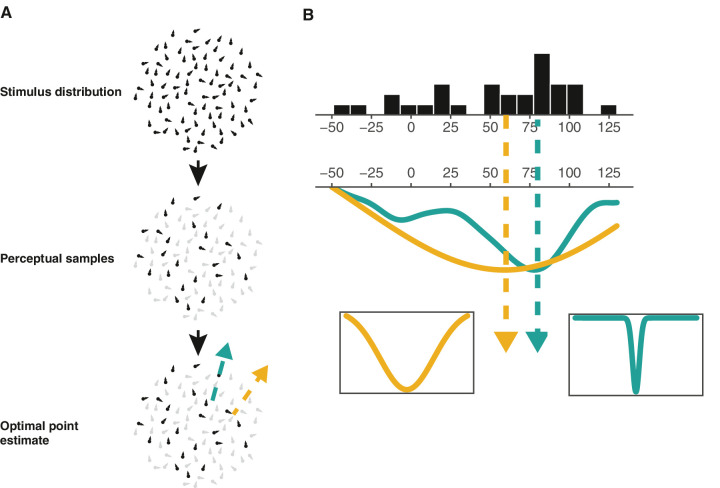
Humans can grasp the "average" feature of a visual ensemble quickly and effortlessly. However, it is largely unknown what is the exact form of the summary statistic humans perceive and it is even less known whether this form can be changed by feedback. Here we borrow the concept of loss function to characterize how the summary perception is related to the distribution of feature values in the ensemble, assuming that the summary statistic minimizes a virtual expected loss associated with its deviation from individual feature values. In two experiments, we investigated a random-dot motion estimation task to infer the virtual loss function implicit in ensemble perception and see whether it can be changed by feedback. On each trial, participants reported the average moving direction of an ensemble of moving dots whose distribution of moving directions was skewed. In Experiment 1, where no feedback was available, participants' estimates fell between the mean and the mode of the distribution and were closer to the mean. In particular, the deviation from the mean and toward the mode increased almost linearly with the mode-to-mean distance. The pattern was best modeled by an inverse Gaussian loss function, which punishes large errors less heavily than the quadratic loss function does. In Experiment 2, we tested whether this virtual loss function can be altered by feedback. Two groups of participants either received the mode or the mean as the correct answer. After extensive training up to five days, both groups' estimates moved slightly towards the mode. That is, feedback had no specific influence on participants' virtual loss function. To conclude, the virtual loss function in the summary perception of motion is close to inverse Gaussian, and it can hardly be changed by feedback.


Figures

Figure 1.
Figure 1.
Task, design, and results of Experiment 1. (A) Time course of one trial. (B) Five possible forms of generative distributions. In each trial, each dot's moving direction was sampled from one Gaussian mixture distribution, whose Mean-Mode distance had five possible levels. Dark color represents larger Mean-Mode distance. (C) The distributions of participants' responses under the five Mean-Mode distance levels. (D) The towards-mode metric in participants' responses increased almost linearly with the Mean-Mode distance. The two dashed lines represent the predicted towards-mode metrics if participants report the mean or mode of the stimulus distribution. (E) The standard deviation of participants' responses also increased with the Mean-Mode distance. Dots denote data from individual participants. The line and its shading denote linear regression fit and its 95% confidence interval.
Figure 2.
Figure 2.
Illustration of sampling-based optimal decision models. (A) Assumptions. The observer draws a fixed number of perceptual samples from the motion stimulus distribution, based on which she derives a point estimate of the overall motion direction. The estimate is an optimal decision that minimizes expected loss. The yellow and green arrows denote the optimal point estimates based on two different loss functions (as shown in B). (B) How different loss functions correspond to different optimal estimates. Black bars denote effective sub-samples from the stimulus distribution. Underneath are the overall losses of different decisions under two different loss functions (a wider and a narrower inverse Gaussian loss functions). The wider loss function corresponds to an optimal estimate closer to the distribution mean, while the narrower loss function corresponds to an optimal estimate closer to the mode.
Figure 3.
Figure 3.
Modeling results of Experiment 1. Data versus model fits for the towards-mode metric (A) and standard deviation (B) of participants’ responses. Error bars denote SE. Only the Ltd-InvGau model fits well to both the bias and the standard deviation patterns. (C) The ΔAICc summed over all participants. Smaller ΔAICc indicates better fit. The probability for the Ltd-InvGau model to outperform all the other models, Pexc, was greater than 99%.
Figure 4.
Figure 4.
Task of Experiment 2 during training. Time course of one trial during training. No feedback was available in pretest and posttest, for which the procedure was the same as Experiment 1.
Figure 5.
Figure 5.
Results of Experiment 2. (A) The change of towards-mode metric in participants’ responses separately for the Mode-feedback (green) and Mean-feedback (yellow) groups. There was no significant interaction between the feedback groups and the experimental sessions. Compared to the pretest, both groups’ towards-mode metric moved slightly closer to the mode of the stimulus distribution in the posttest. (B) The change of participants’ response SD. (C) Results of model comparisons based on the pretest and posttest responses. We considered eight models whose assumptions are combinations of the following three factors: whether (1) sample size, (2) loss function, and (3) late noise have been fixed (denoted “F”) or variant (denoted “V”) across pretest and posttest. Lower AICc indicates better fit. The probability for the winning model ([F-sample, V-loss, V-noise]) to outperform all the other models, Pexc, was 95.3%.

Similar articles

Cited by

References

    1. Akaike, H. (1974). A new look at the statistical model identification. IEEE Transactions on Automatic Control , 19(6), 716–723, doi:10.1109/TAC.1974.1100705. - DOI
    1. Albrecht, A. R., & Scholl, B. J. (2010). Perceptually averaging in a continuous visual world: Extracting statistical summary representations over time. Psychological Science , 21(4), 560–567, doi:10.1177/0956797610363543. - DOI - PubMed
    1. Alvarez, G. A. (2011). Representing multiple objects as an ensemble enhances visual cognition. Trends in Cognitive Sciences , 15(3), 122–131, doi:10.1016/j.tics.2011.01.003. - DOI - PubMed
    1. Ariely, D. (2001). Seeing sets: Representation by statistical properties. Psychological Science , 12(2), 157–162, doi:10.1111/1467-9280.00327. - DOI - PubMed
    1. Barr, D. J., Levy, R., Scheepers, C., & Tily, H. J. (2013). Random effects structure for confirmatory hypothesis testing: Keep it maximal. Journal of Memory and Language , 68(3), 255–278, doi:10.1016/j.jml.2012.11.001. - DOI - PMC - PubMed

Publication types

LinkOut - more resources