. 2021 May 4:10:e66165.
doi: 10.7554/eLife.66165.

Autism-associated SHANK3 missense point mutations impact conformational fluctuations and protein turnover at synapses

Affiliations

Autism-associated SHANK3 missense point mutations impact conformational fluctuations and protein turnover at synapses

Michael Bucher et al. Elife. .

Abstract

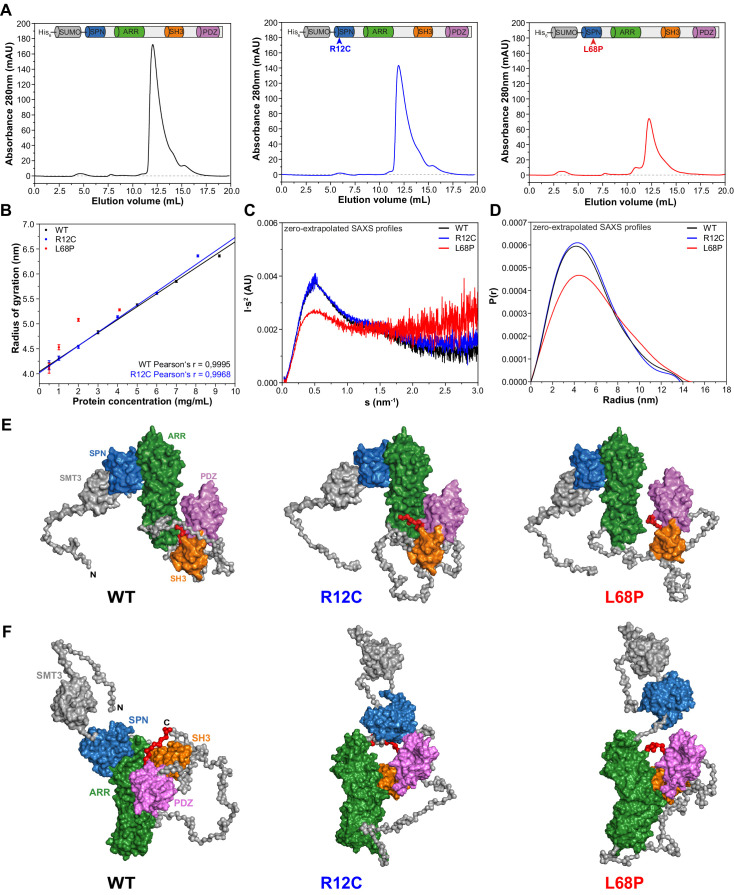
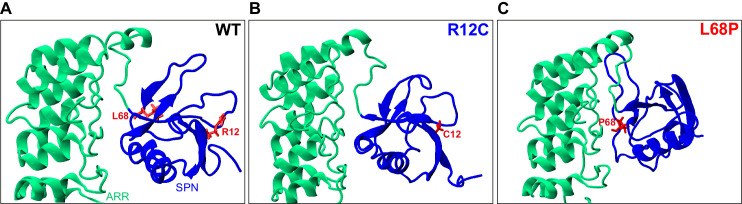
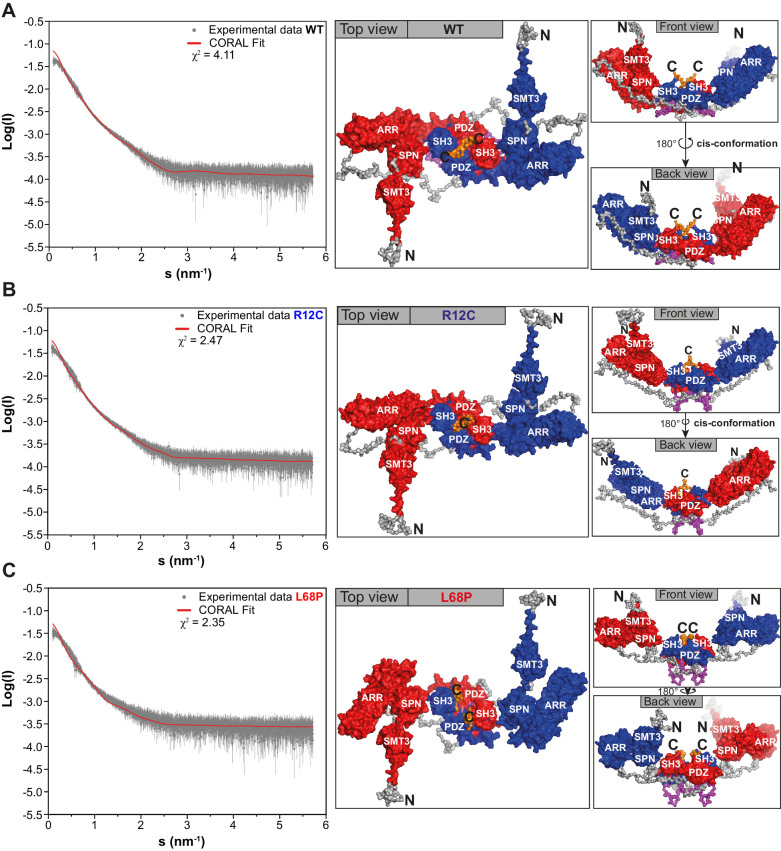
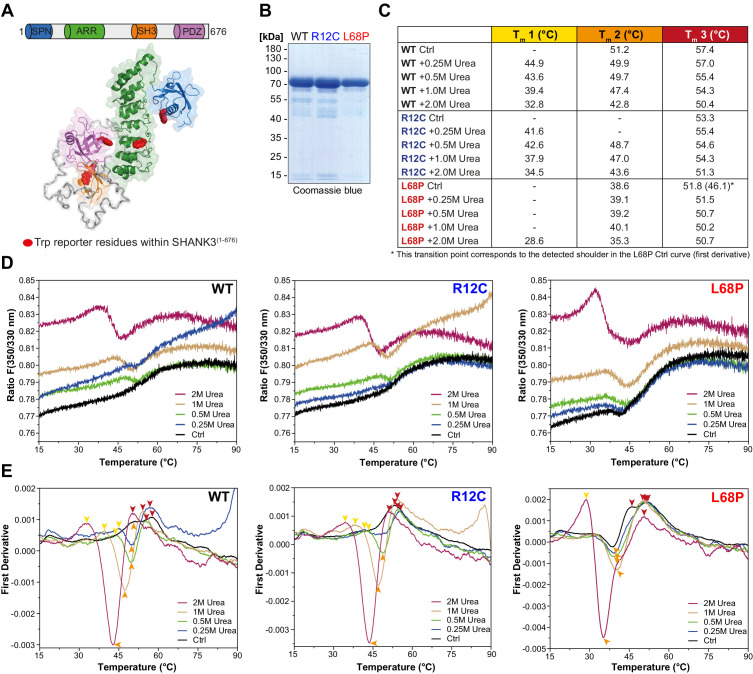
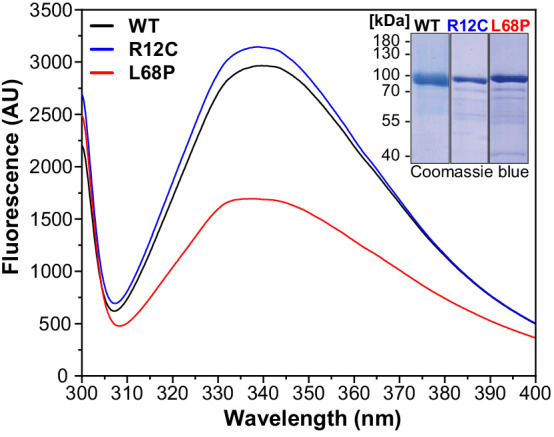
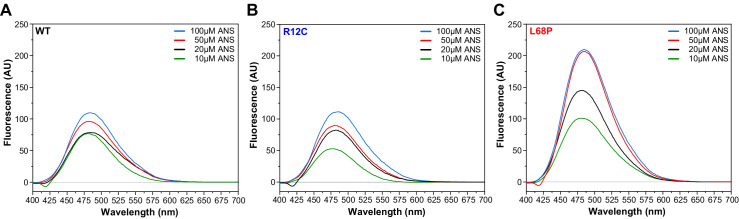
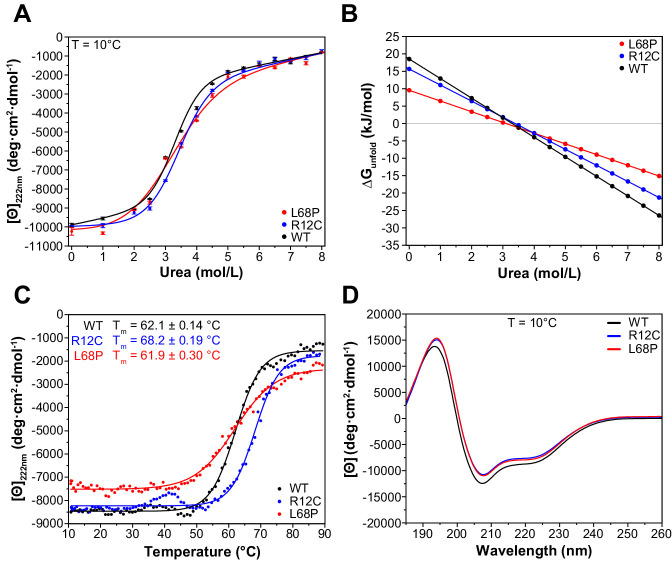
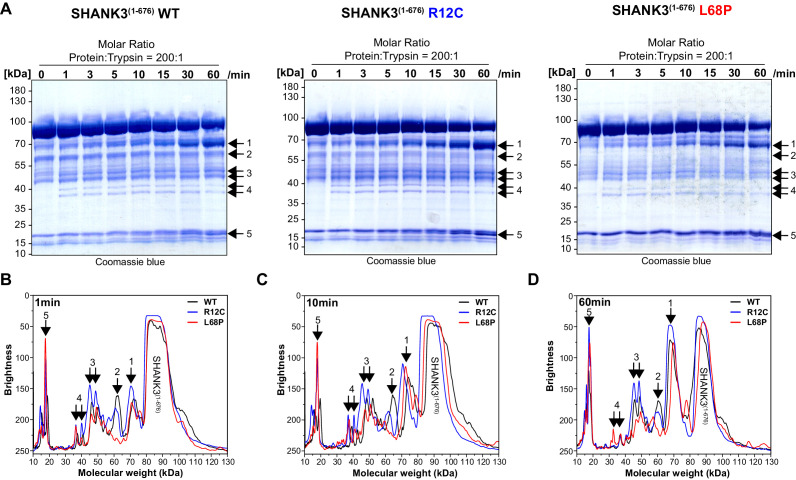
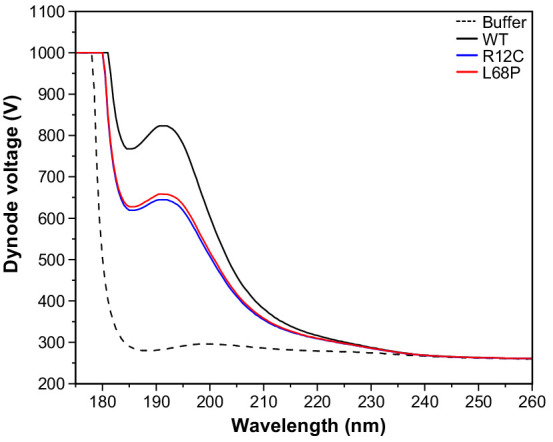
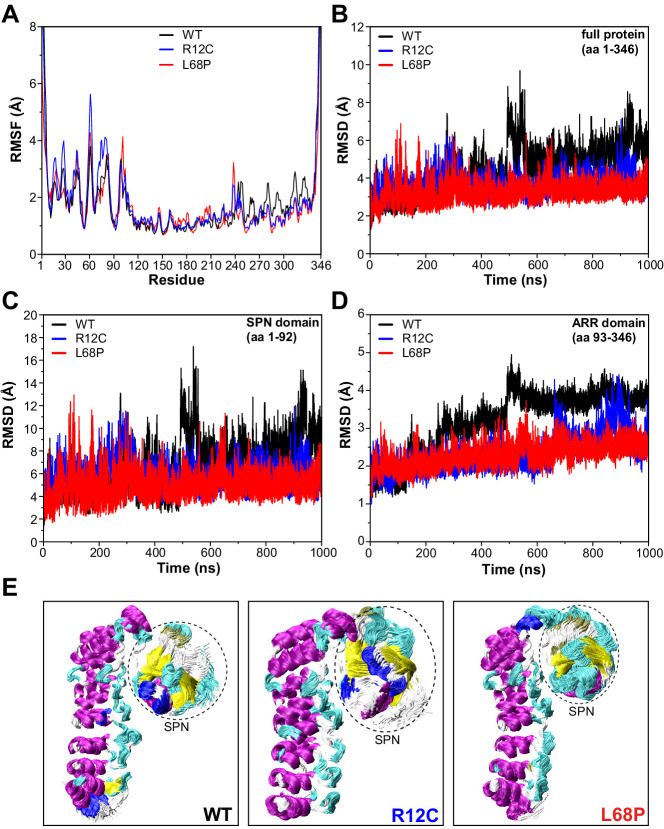
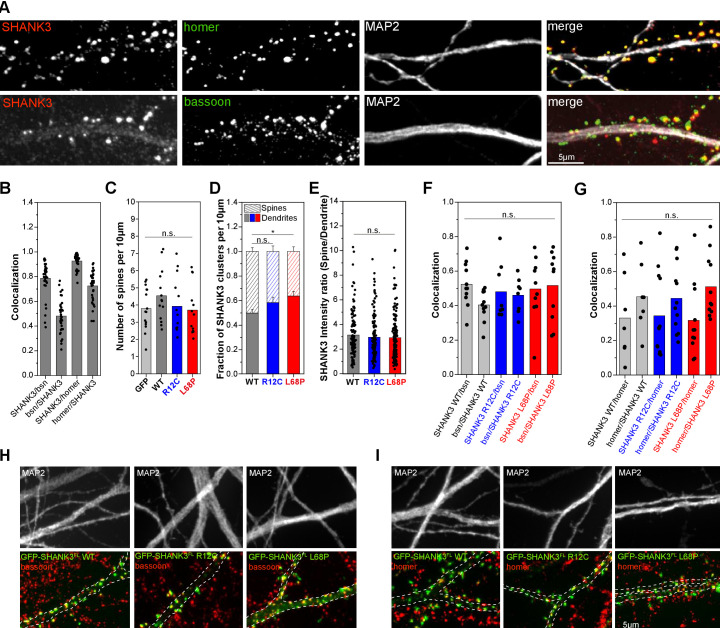
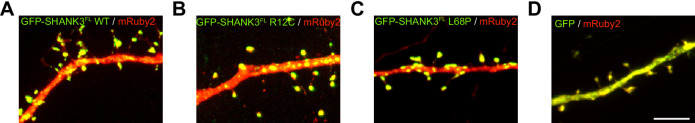
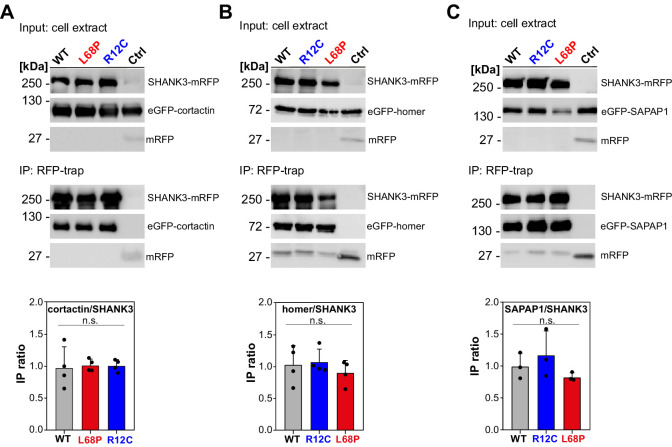
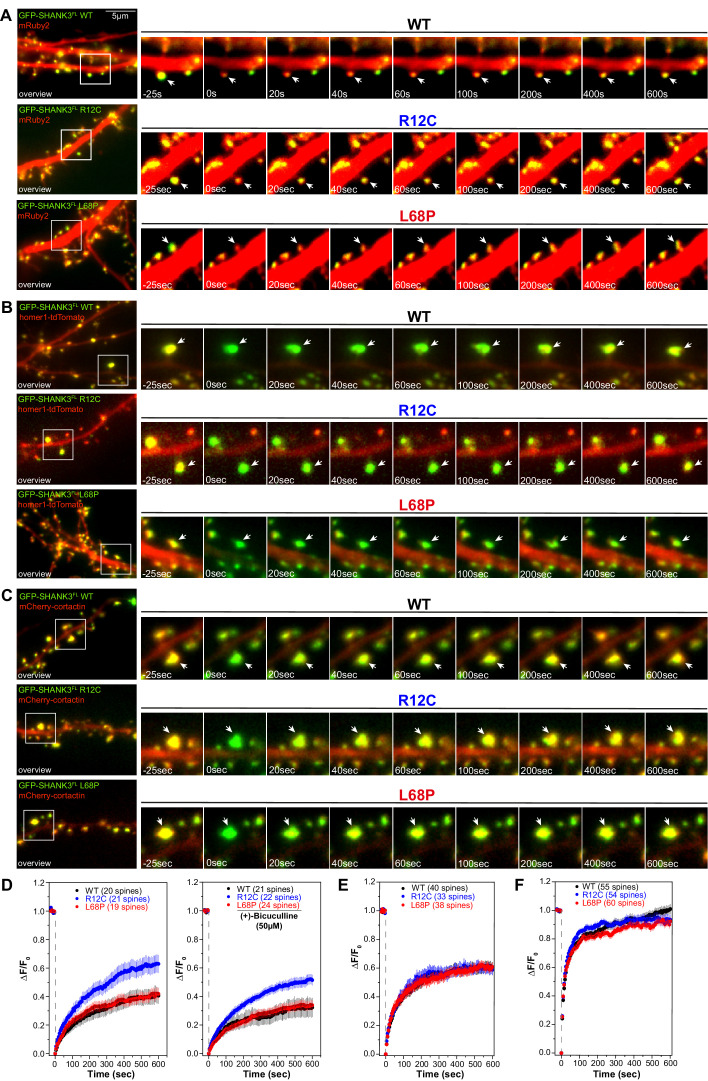
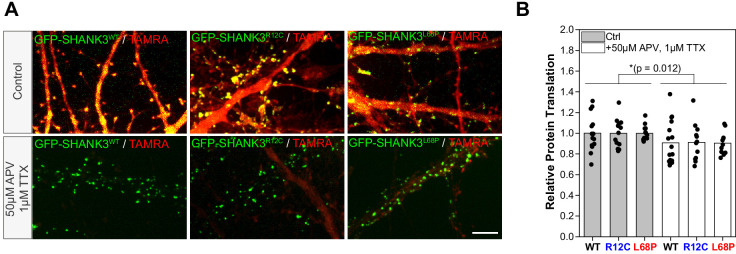
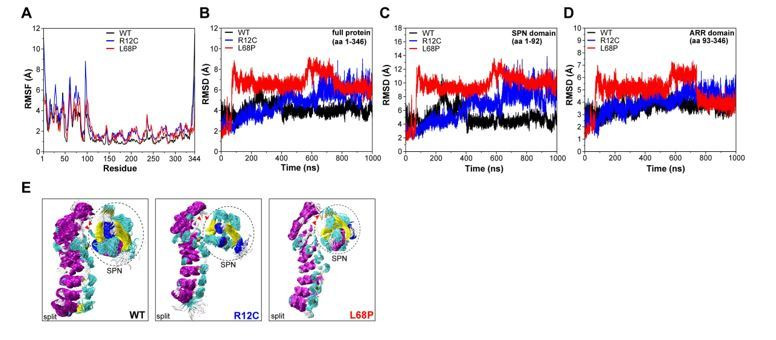
Members of the SH3- and ankyrin repeat (SHANK) protein family are considered as master scaffolds of the postsynaptic density of glutamatergic synapses. Several missense mutations within the canonical SHANK3 isoform have been proposed as causative for the development of autism spectrum disorders (ASDs). However, there is a surprising paucity of data linking missense mutation-induced changes in protein structure and dynamics to the occurrence of ASD-related synaptic phenotypes. In this proof-of-principle study, we focus on two ASD-associated point mutations, both located within the same domain of SHANK3 and demonstrate that both mutant proteins indeed show distinct changes in secondary and tertiary structure as well as higher conformational fluctuations. Local and distal structural disturbances result in altered synaptic targeting and changes of protein turnover at synaptic sites in rat primary hippocampal neurons.

Keywords: SHANK3; autism; conformational dynamics; neuroscience; postsynaptic density; protein folding; rat; synaptic protein turnover.


Conflict of interest statement

MB, SN, YH, DM, FH, HK, DS, EK, AK, MK, MM No competing interests declared

Figures

Figure 1.
Figure 1.. Small-angle X-ray scattering from ASD-associated SHANK3 mutants shows changes in protein folding and topology.
(A) Size-exclusion chromatograms of Ni2+-IDA pre-purified His6-SUMO-SHANK3(1-676) variants are shown (elution peak at ~12.0 mL). The individual elution peaks were used for SAXS. (B) Rg values derived from Guinier approximation in the range of sRg <1.3 of SAXS profiles measured at different protein concentrations. The WT and R12C mutant show a linear increase of Rg with protein concentration, which suggests the presence of attractive interparticle interactions. (C) Kratky plots from zero-extrapolated SAXS profiles of the WT and R12C mutant resemble the profile of a folded multidomain protein with flexible linkers, while the L68P mutant appears to be partially unfolded. (D) Distance distribution curves were computed with GNOM using zero-extrapolated SAXS profiles as input data. Particles were assumed to be arbitrary monodisperse. The curves indicate a maximum particle diameter (Dmax) of ~14–15 nm for monomeric SHANK3(1-676) without significant alterations due to ASD-associated mutations. (E) Rigid-body CORAL models of the SHANK3 complex topology in solution. High-resolution structures of individual SHANK3 fragments were fitted against zero-extrapolated SAXS profiles without assuming any higher order symmetry (space group P1). The SPN and ARR domains were treated as a single rigid body (PDB 5G4X). The models indicate distal effects of both mutations on the position of the SH3 domain (orange) and PDZ domain (magenta) relative to the ARR domain (green) as well as changes in the orientation of linker regions. (F) CORAL models of monomeric His6-SUMO-SHANK3(1-676) variants with split SPN/ARR domains, where the linker region has been replaced by flexible dummy residues, capture mutation-induced perturbations of the SPN/ARR domain interface. Perspectives of visualized structures were chosen to facilitate highest visibility of structural regions of interest. All acquired SAXS data including fits and models were deposited to SASBDB (WT: SASDLJ3, R12C: SASDLL3 and L68P: SASDLK3). SAXS = small-angle X-ray scattering, ASD = autism spectrum disorders, Rg = radius of gyration, WT = wild type, SPN = SHANK/ProSAP N-terminal, ARR = ankyrin repeat.
Figure 1—figure supplement 1.
Figure 1—figure supplement 1.. Localization of ASD-associated mutation sites in the SHANK3(1-346) input topology of molecular dynamics simulations.
(A) The two mutated residues R12 and L68 of SHANK3 are highlighted in red. Both residues are located within the N-terminal SPN domain of SHANK3. (B) The R12C mutation is shown to be localized within an antiparallel beta sheet directly at the SHANK3 N-terminus. (C) The L68P mutation is found in a locally disordered region within the SPN domain. In comparison, the non-mutated L68 residue is located in close vicinity to an antiparallel beta sheet as seen in A. The structures were generated as described in the 'Molecular dynamics' section and were visualized with VMD 1.9.3. ASD = autism spectrum disorders, SPN = SHANK/ProSAP N-terminal.
Figure 1—figure supplement 2.
Figure 1—figure supplement 2.. Schematic overview of protein purification steps involved in the preparation of His6-SUMO-SHANK3(1-676) and SHANK3(1-676) variants.
(A) Expression of His6-SUMO-SHANK3(1-676) variants was induced with 300 μM IPTG in BL21(DE3) E. coli bacteria and continued for 18 hr at 18°C. Bacteria were lysed and proteins were pre-purified over Ni2+-IDA as described in the protein purification section of the materials and methods chapter. For SAXS, proteins were batch eluted from the Ni2+-IDA column (bed volume ~2 mL) with 200 mM Imidazole and were subsequently subjected to size-exclusion chromatography (SEC) using an analytical Superdex 75 10/300 GL column (0.4 mL/min; GE Healthcare). Peak fractions were pooled and concentrated to obtain sufficiently pure His6-SUMO-SHANK3(1-676) variants. To facilitate measurements over a broader concentration range, the His6-SUMO-tag was not removed for SAXS studies. (B) For complementary CD spectroscopy and nDSF measurements, the SUMO-tag was removed by treatment with the home-made SUMO protease His6-SenP2 (~0.3 mg/mL final concentration) followed by dilution to reduce the Imidazole concentration to approximately 30 mM. Removal of the His6-SUMO-tag as well as His6-SenP2 was done by two additional passages over a freshly packed Ni2+-IDA column (bed volume ~2 mL). (C) For buffer exchange, diluted proteins were initially concentrated by ultrafiltration and passed over a PD10 desalting column (GE Healthcare). Final protein re-concentration yielded SHANK3(1-676) variants in sufficient purity for subsequent measurements. SAXS = small-angle X-ray scattering.
Figure 1—figure supplement 3.
Figure 1—figure supplement 3.. Guinier plots and pair distance distribution functions (PDDFs) from SAXS profiles measured at different concentrations.
(A) Guinier plots show protein concentration-dependent changes in the slope of the Guinier fit, suggesting the presence of interparticle effects. A suitable Guinier range was detected by the AUTORG function of the ATSAS 3.0.1 software package. (B) PDDFs indicate a concentration-dependent increase in the maximum particle diameter (Dmax) which corroborates the idea of potential SAM domain independent self-interaction of SHANK3(1-676). All PDDFs were obtained from GNOM analysis using the ATSAS 3.0.1 software package. (C) Monomeric SHANK3 volume fractions were estimated by OLIGOMER analysis using the ATSAS 3.0.1 software package. Thereby, monomeric and dimeric SHANK3 models obtained from CORAL analyses were fitted against SAXS profiles measured at given concentrations of His6-SUMO-SHANK3(1-676) including zero-extrapolated SAXS profiles. SAXS data extrapolated to infinite dilution almost exclusively contains scattering contributions from monomeric His6-SUMO-SHANK3(1-676). However, the amount of monomeric His6-SUMO-SHANK3(1-676) contributing to the experimental scattering profiles decreases with increasing protein concentration, suggesting a dynamic and concentration-dependent monomer-dimer equilibrium. SAXS = small-angle X-ray scattering, WT = wild type.
Figure 1—figure supplement 4.
Figure 1—figure supplement 4.. CORAL-derived models of a dimeric SHANK3 protein complex topology in solution.
For the CORAL input, experimental SAXS profiles have been merged between highest and lowest concentrations. (A) The CORAL fit for His6-SUMO-SHANK3(1-676) WT suggests that the protein could partially exist in a homo-dimeric form in solution, which is formed by a dual interface between SH3 and PDZ domains. The two large ankyrin-rich repeat domains (ARR) are oriented in a cis-conformation as is visible from the front and back view. (B) The ASD-associated R12C mutation is predicted to have no major impact on the complex topology of His6-SUMO-SHANK3(1-676). (C) The more dominant L68P mutation is predicted to result in an altered orientation of the ARR domains and the position of the SMT3-SPN-ARR domain cluster is altered with respect to the SH3-PDZ cluster. SAXS = small-angle X-ray scattering, WT = wild type, ASD = autism spectrum disorders.
Figure 1—figure supplement 5.
Figure 1—figure supplement 5.. Zero-extrapolated SAXS data fitted with CORAL to derive structural models of monomeric His6-SUMO-SHANK3(1-676) variants in solution.
(A) Individual zero-extrapolated SAXS profiles were fitted with CORAL using high-resolution structures of individual SHANK3 domains. Here, the SPN and ARR domains were treated as a single rigid body (PDB 5G4X). (B) To capture potential mutation-induced disruptions of the SPN/ARR domain interface, the linker region (sequence KRRVYAQNLI) was removed from PDB 5G4X in silico and was replaced by the same number of dummy residues during CORAL fitting to allow flexible reorientation of the SPN domain. The corresponding models are shown in Figure 1E and F. SAXS = small-angle X-ray scattering, ARR = ankyrin repeat, SPN = SHANK/ProSAP N-terminal, WT = wild type.
Figure 2.
Figure 2.. ASD-associated SHANK3 mutations differentially affect protein tertiary structure.
(A) Schematic representation of the SHANK3(1-676) fragment, which was used for nDSF measurements. Intrinsic tryptophan (Trp) reporter residues are highlighted in the structure, which was derived from SAXS data. (B) SDS-PAGE of Ni2+-NTA purified SHANK3(1-676) variants which were used for nDSF and CD spectroscopy. (C) Overview of detected melting points from peaks of first derivative curves (from E). Due to the complex melting behavior, melting was classified in three transition zones (Tm1Tm3) which are partially overlapping. (D) Label-free determination of thermal and chemical stability of purified SHANK3(1-676) variants by intrinsic fluorescence emission depicted as ratio of 350/330 nm as a function of temperature. Melting curves were acquired at a protein concentration of ~0.5 mg/mL, 50% excitation power and with a heating rate of 1°C/min. (E) First derivative analysis of melting curves shown in (D). Transition points are indicated with colored arrowheads (color-coded according to the transition zones) and shifted toward lower temperatures with increasing urea concentration, as expected. For the L68P mutant, considerably lower melting points are detected compared to the WT or R12C mutant, suggesting a reduced thermal stability of the tertiary structure. ASD = autism spectrum disorders, SAXS = small-angle X-ray scattering, WT = wild type.
Figure 2—figure supplement 1.
Figure 2—figure supplement 1.. Intrinsic tryptophan fluorescence emission spectra of His6-SUMO-SHANK3(1-676) variants.
Fluorescence spectra were recorded from 2 µM protein solutions at room temperature (excitation wavelength = 295 nm, scan speed = 240 nm/min). Spectra show a profound reduction in tryptophan fluorescence intensity of the ASD-associated L68P mutant, suggesting an increased fraction of exposed tryptophan residues due to solvent quenching, which could be attributed to partial unfolding of the L68P mutant. This effect is absent for the R12C mutant. The inset shows representative SDS gels from Ni2+-IDA purified His6-SUMO-SHANK3(1-676) variants. ASD = autism spectrum disorders, IDA = imidazole, WT = wild type.
Figure 2—figure supplement 2.
Figure 2—figure supplement 2.. Measurement of His6-SUMO-SHANK3(1-676) surface hydrophobicity by extrinsic ANS fluorescence spectroscopy.
(A) Fluorescence spectra were acquired from a 2 µM protein solution in purification buffer at room temperature after addition of 10–100 µM 1-anilinonaphthalene-8-sulphonate (ANS) in a 10 mm rectangular quartz cell (excitation wavelength = 365 nm, scan speed = 240 nm/min). Fluorescence intensity at the ANS emission maximum of 480 nm increased continuously by increasing concentration of ANS up to 100 µM within the same sample. (B) In the presence of 10 µM ANS, the fluorescence intensity at 480 nm is reduced compared to the WT. Overall, however, extrinsic ANS fluorescence spectra do not show significant differences between the R12C mutant and WT. (C) Fluorescence intensities are generally increased significantly for the L68P mutant, suggesting an increased protein surface hydrophobicity. This is consistent with intrinsic tryptophan fluorescence emission and SAXS data indicating that the L68P mutant is partially unfolded under these conditions. SAXS = small-angle X-ray scattering, WT = wild type.
Figure 3.
Figure 3.. ASD-associated SHANK3 mutants show structural alterations at secondary structure level.
(A) Isothermal chemical unfolding curves with urea as denaturant are depicted (222 nm, 3 s/point, 25 µs sample period, three repeats, T = 10.0 ± 0.2°C, protein concentration ~0.15 mg/mL). The data has been fitted to a two-state unfolding transition model. Transition midpoints do not vary significantly but differences occur in the slopes of the corresponding folded and unfolded baselines. (B) Unfolding free energies are calculated from fitted parameters obtained in (A) using a linear free energy model. Both mutants show a reduced unfolding cooperativity and thermodynamic stability when unfolding is induced with urea. (C) Thermal unfolding curves have been acquired from samples measured in (B) in the presence of 2.0 M urea to prevent thermally induced protein aggregation preceding actual secondary structure melting (222 nm, 3 s/point, 25 µs sample period, 10–90°C T range, 1.0°C step size, 1.0°C/min stepped ramping with 30 s settling time and 0.5°C tolerance). Thermal unfolding curves reveal an increased secondary structure stability of the R12C mutant (dynode voltage = 370–400 V between 10 and 90°C). (D) Far-UV CD spectra of SHANK3(1-676) variants are shown in the range of 260–185 nm (0.5 nm step size, 3 s/point, 25 µs sample period, three repeats, T = 10.0 ± 0.2°C). Immediately before measurement, proteins have been buffer exchanged to 10 mM KH2PO4, 100 mM KF, 0.5 mM DTT, pH = 6.50. Differences between WT and mutant protein spectra are minor. ASD = autism spectrum disorders, WT = wild type.
Figure 3—figure supplement 1.
Figure 3—figure supplement 1.. Limited trypsin proteolysis of SHANK3(1-676) variants.
(A) For limited proteolysis at room temperature, SHANK3(1-676) variants are used at a concentration of 13.5 µM (1 mg/mL). As trypsin source, 0.05% (21 µM) trypsin-EDTA (Gibco, ThermoFisher) is pre-diluted with water to 1 µM and used in a final concentration of 67 nM. For each protein variant, a 8x reaction mix is prepared by mixing SHANK3(1-676), pre-diluted trypsin-EDTA, and water to obtain a molar ratio of protein:trypsin of 200:1. At each timepoint, an aliquot of the reaction mix is removed and immediately transferred into preheated 2x SDS-Loading Buffer at 95°C. Samples are boiled for 5 min and subsequently analyzed by SDS-PAGE. (B) Line profile analysis of SDS-PAGE lanes after 1 min of limited proteolysis of SHANK3(1-676) variants. Line profiles were measured in Fiji (15 px line width) and the molecular weight was estimated based on an exponential decay fit of the running behavior of SDS-PAGE marker bands (PageRuler, 10–180 kDa, ThermoFisher). For the R12C mutant, several fragments show a lower brightness or higher abundance compared to the WT or L68P mutant (regions 1 and 3). (C) After 10 min of limited proteolysis, both mutants show a higher fragment abundance in region 1 compared to the WT. Interestingly, the fragment in region 2 is fully absent for the L68P mutant. (D) After 1 hr of limited proteolysis, both mutants show an increased abundance of residual, uncleaved protein. Additionally, fragments of the R12C mutant in regions 1 and 3 are more abundant compared to WT or L68P, consistent with the profile observed after 1 min. Overall, the R12C mutant seems to exhibit a mildly decreased cleavability which might suggest a higher structural stability or reduced structural accessibility by trypsin. On the other hand, the L68P mutant shows slightly increased cleavage of individual fragments (regions 2 and 3) or is comparable to the profile observed for the WT (region 1), possibly suggesting reduced structural stability or higher accessibility by trypsin. WT = wild type.
Figure 3—figure supplement 2.
Figure 3—figure supplement 2.. CD PMT voltage as a function of wavelength.
CD spectra have been recorded between 175 and 260 nm for a ~ 0.1 mg/mL solution of purified SHANK3(1-676) variants in 10 mM KH2PO4, 100 mM KF, 0.5 mM DTT, pH = 6.5 using a rectangular quartz cuvette with 1 mm pathlength. For the CD spectra presented in Figure 3D, the dynode voltage is shown here as a function of wavelength.
Figure 4.
Figure 4.. SHANK3 mutants show altered intra-domain conformational dynamics.
(A) Cα backbone RMSF calculated for the trajectories of the SHANK3(1-346) fragment (PDB: 5G4X) either as WT or carrying one of the ASD-associated mutations R12C (blue) or L68P (red) show increased fluctuations for both mutants predominantly within the first 100 residues of the protein possibly suggesting a local mutation-induced increase in protein backbone dynamics. (B) Cα backbone RMSD determined for the full protein (aa 1–346). Within the first 100ns both mutants tend to show slightly increased backbone dynamics. This effect inverts with extended sampling time and mutants show on average reduced conformational dynamics compared to the WT. (C) Cα backbone RMSD restricted to the SPN domain of SHANK3 (aa 1–92). The traces resemble those observed for the full protein (aa 1–346) but absolute RMSD values are considerably larger for the SPN domain. (D) Cα backbone RMSD restricted to the ARR domain of SHANK3 (aa 93–346). The WT protein shows a stepwise increase in RMSD over time possibly indicating switches between distinct conformational states. This behavior is largely missing in both mutants but is more prominent for the L68P variant. (E) Local hotspots of conformational dynamics can be seen within the SPN domain (encircled) from overlays of individual frames of the trajectory (every fifth frame loaded, overlay [beginning:step:end]=0:20:20002 resulting in 1000 frames). RMSF = root mean square fluctuation, WT = wild type, ASD = autism spectrum disorders, RMSD = root mean square deviation.
Figure 5.
Figure 5.. Mutant SHANK3 variants form more clusters in dendritic shaft.
(A) Representative images of immunostained endogenous SHANK3 (red), homer or bassoon (green), and MAP2 (gray). (B) Quantification of the co-localization (SHANK3/bsn and bsn/SHANK3: n = 36 cells from two independent cultures; SHANK3/homer and homer/SHANK3: n = 36 cells from two independent cultures). Bars are showing the mean as well as individual data points. Approximately 72% of homer-positive spines are also SHANK3-positive, while ~93% of SHANK3-positive spines co-localize with homer. Additionally, ~79% of SHANK3-positive spines co-localize with the presynaptic marker bassoon. (C) Quantification of the total number of spines per 10 µm in primary rat hippocampal neurons overexpressing GFP-SHANK3FL variants for 16–18 hr (GFP: 15 cells from four independent cultures, WT: 14 cells from three independent cultures, R12C: 13 cells from four independent cultures, L68P: 13 cells from four independent cultures). Bars are showing the mean as well as individual data points. No significant differences in average spine numbers is found (Kruskal-Wallis ANOVA with Dunn’s post hoc test: p=0.59–1). (D) Analysis of SHANK3 cluster distribution in neurons overexpressing GFP-SHANK3FL variants (same dataset as in (C)). Bars are showing mean ± SEM. No significant effect of the R12C mutation on the relative distribution of SHANK3 clusters between spines and dendrites is found. The L68P mutation caused a significant increase in dendritic SHANK3 clusters (Kruskal-Wallis ANOVA with Dunn’s post hoc test: p(WT/R12C)=0.42; p(WT/L68P)=0.04 and p(R12C/L68P)=0.93 at p=95%). (E) Line profile analysis of the SHANK3 distribution between spines and dendrites (WT: 12 cells from four independent cultures, R12C: 11 cells from four independent cultures, L68P: 12 cells from five independent cultures). Bars are showing the mean as well as individual data points. No differences in the mean SHANK3 intensity ratio between spines and dendrites are found (one-way ANOVA with Bonferroni multiple comparisons test: p(WT/R12C)=1 and p(WT/L68P)=0.83 at p=95%). (F) Quantification of bassoon (bsn)/SHANK3 and SHANK3/bsn co-localization on dendritic clusters of neurons overexpressing GFP-SHANK3FL variants (WT: n = 11 cells from three independent cultures; R12C: n = 8 cells from three independent cultures; L68P: n = 10 cells from three independent cultures). No significant differences between genotypes are found (Kruskal-Wallis ANOVA with Dunn’s post hoc test: SHANK3/bsn co-localization: p(WT/R12C)=1; p(WT/L68P)=1; and p(R12C/L68P)=1 at p=95%; bsn/SHANK3 co-localization: p(WT/R12C)=1; p(WT/L68P)=1; and p(R12C/L68P)=1 at p=95%). Bars are showing the mean as well as individual data points per cell. (G) Quantification of homer/SHANK3 and SHANK3/homer co-localization on dendritic clusters of neurons overexpressing GFP-SHANK3FL variants (WT: n = 7 cells from two independent cultures; R12C: n = 12 cells from two independent cultures; L68P: n = 11 cells from two independent cultures). No significant differences between genotypes are found (Kruskal-Wallis ANOVA with Dunn’s post hoc test: SHANK3/homer co-localization: p(WT/R12C)=1; p(WT/L68P)=1; and p(R12C/L68P)=1 at p=95%; homer/SHANK3 co-localization: p(WT/R12C)=1; p(WT/L68P)=1; and p(R12C/L68P)=1 at p=95%). Bars are showing the mean as well as individual data points. (H) Representative images of GFP-SHANK3FL expressing neurons, co-stained for MAP2 and bassoon. The MAP2 signal was used as a mask to draw the outline of dendrites. Co-localization of GFP-SHANK3FL clusters with bassoon was analyzed within the MAP2 mask. (I) Representative images of GFP-SHANK3FL expressing neurons, co-stained for MAP2 and homer. Co-localization of GFP-SHANK3FL clusters with homer was analyzed within the MAP2 mask. WT = wild type.
Figure 5—figure supplement 1.
Figure 5—figure supplement 1.. Representative images of hippocampal primary neurons overexpressing GFP-SHANK3FL variants.
(A–D) In addition to the quantification of spine numbers and cluster densities presented in Figure 5C and D, representative images of hippocampal primary neurons overexpressing GFP-SHANK3FL variants for less than 24 hr are shown. Overexpression of ASD-associated mutants does not seem to significantly alter the number and morphology of spines but increases the number of dendritic SHANK3 clusters. ASD = autism spectrum disorders.
Figure 6.
Figure 6.. Mutant SHANK3 variants readily interact with cortactin, homer, and SAPAP1.
(A) A representative western blot from co-IP assays of SHANK3 and cortactin from HEK293 cells is shown (detection SHANK3: rat-α-mRFP, 1 s; detection cortactin: mouse-α-GFP, 1 s; n = 4 independent experiments). No difference in binding of cortactin to ASD-associated SHANK3 mutants can be detected compared to the WT (one-way ANOVA with Bonferroni multiple comparisons test: p(WT/R12C)=1, p(WT/L68P)=1, and p(R12C/L68P)=1 at p=95%). (B) Representative western blot from co-IPs of SHANK3 and homer (detection SHANK3: rat-α-mRFP, 1 s; detection homer: mouse-α-GFP, 1.5 s; n = 4 independent experiments). No difference in binding of homer to the tested SHANK3 mutants can be found compared to the WT (one-way ANOVA with Bonferroni multiple comparisons test: p(WT/R12C)=1, p(WT/L68P)=1, and p(R12C/L68P)=0.99 at p=95%). (C) Representative western blot from co-IPs of SHANK3 and SAPAP1 (detection SHANK3: rat-α-mRFP, 9 s; detection SAPAP1: mouse-α-GFP, 2 s; n = 3 independent experiments). No difference in binding of SAPAP1 to the SHANK3 mutants can be detected compared to the WT (one-way ANOVA with Bonferroni multiple comparisons test: p(WT/R12C)=1, p(WT/L68P)=1, and p(R12C/L68P)=0.41 at p=95%). co-IP = co-immunoprecipitation, WT = wild type, ASD = autism spectrum disorders.
Figure 7.
Figure 7.. Mutations of SHANK3 differentially affect the protein residing time in spines and dynamics of distinct interaction partners.
(A) Representative images of photobleached spines (488 nm) are shown at selected time points to illustrate the dynamics of GFP-SHANK3FL variants in primary rat hippocampal neurons. (B) Representative images of photobleached spines (561 nm) co-expressing homer1-tdTomato and GFP-SHANK3FL (WT, R12C, or L68P) are shown at selected timepoints during FRAP to illustrate the dynamics of homer1 in the presence of different SHANK3 variants. (C) Representative images of photobleached spines (561 nm) co-expressing mCherry-cortactin and GFP-SHANK3FL (WT, R12C, or L68P) are shown at selected timepoints during FRAP to illustrate the dynamics of cortactin in the presence of different SHANK3 variants. (D) FRAP curves demonstrating the dynamics of mutant SHANK3 in spines. The R12C mutant is displaying an increased recovery corresponding to a reduced residing time in spines (Kruskal-Wallis ANOVA with Dunn’s post hoc test; untreated: p(WT/R12C)<0.0001, p(R12C/L68P)<0.0001, and p(WT/L68P)=1; bic: p(WT/R12C)<0.0001, p(R12C/L68P)<0.0001, and p(WT/L68P)=1). All tested SHANK3 variants show a mildly decreased recovery after pharmacological stimulation with (+)-Bicucullin (5 min, 37°C, 5% CO2; data collected from three independent cultures for control curves and two independent cultures for (+)-Bicucullin stimulation). (E) FRAP curves showing the dynamics of homer1 in the presence of different GFP-SHANK3FL variants (WT, R12C, L68P). ASD-associated SHANK3 mutants cause no difference in the recovery of homer1 (Kruskal-Wallis ANOVA with Dunn’s post hoc test; p(WT/R12C)=1, p(R12C/L68P)=1, and p(WT/L68P)=1). (F) FRAP curves showing the dynamics of cortactin in the presence of different GFP-SHANK3FL variants (WT, R12C, L68P). Qualitatively, both SHANK3 mutants alter the recovery kinetics of cortactin. Additionally, the L68P mutant significantly reduces the mobile fraction of cortactin in spines (Kruskal-Wallis ANOVA with Dunn’s post hoc test; p(WT/R12C)=1, p(R12C/L68P)=0.0002, and p(WT/L68P)=0.0007). WT = wild type, FRAP = fluorescence recovery after photobleaching.
Figure 7—figure supplement 1.
Figure 7—figure supplement 1.. Global de novo protein synthesis in hippocampal primary neurons overexpressing GFP-Shank3FL variants monitored by fluorescence non-canonical amino acid tagging (FUNCAT).
(A) To analyze potential changes in global protein turnover of hippocampal primary neurons induced by ASD-associated SHANK3 missense variants, neurons were cultured in the presence of the methionine-analog L-azidohomoalanine (AHA). Newly synthesized proteins, which incorporated the modified amino acid, were visualized by Cu(I)-catalyzed azide-alkyne click reaction (CuAAC) with tetramethylrhodamine (TAMRA) alkyne. To test the activity dependence of de novo protein synthesis, neurons were additionally silenced with 1 µM tetrodotoxin (TTX) and 50 µM D-(-)−2-amino-5-phosphonopentanoic acid (D-APV) prior to metabolic labeling. For each condition, representative images (20 × 30 µm, scale bar = 5 µm) are shown. (B) For quantification of de novo protein synthesis in dendritic spines, labeled neurons were immunostained for homer to facilitate spine detection (not shown). The TAMRA intensity for each cell was measured in spines with detected co-localization of homer and GFP-SHANK3. Thereby, homer-positive spines without a GFP-SHANK3 signal were used for normalization. The relative protein translation is plotted as a ratio between the average TAMRA intensity of all GFP-SHANK3 positive and negative spines for each cell. Data is additionally normalized to the untreated control group. The quantification shows a significant reduction in relative protein translation after neuronal silencing but no significant effect of the SHANK3 variant (two-way ANOVA with Tukey post hoc test, p=0.012 for treatment, p=0.529 for genotype, p=95%). The data was obtained from three independent cultures (Ctrl: N(WT)=14 cells, N(R12C)=13 cells, N(L68P)=13 cells; treatment: N(WT)=16 cells, N(R12C)=12 cells, N(L68P)=11 cells).
Author response image 1.
Author response image 1.. SAXS EOM analysis of His6-SUMO-SHANK3(1-676) protein flexibility.
(from left to right)The ensemble distributions of the maximum particle diameter (Dmax) as well as the radius of gyration (Rg) are shown for His6SUMO-SHANK3(1-676) variants. Differences in the degree of flexibility (Rflex) of selected sub-ensembles between the WT and mutants are in the range of 1.5 – 4%, which is negligible.
Author response image 2.
Author response image 2.. Molecular dynamics simulations of split SPN-ARR domains.
(A) Cα backbone RMSF calculated for trajectories of the SHANK3(1-346) fragment (PDB: 5G4X), where the SPN- and ARR-domain have been split in silico in the linker region. Both mutants show increased fluctuations within the first 100 residues. (B) Cα backbone RMSD determined for the full protein (aa 1-346) with split SPN/ARR domains. Overall, ASD-associated mutants clearly show significantly increased backbone dynamics (C) Cα backbone RMSD restricted to the SPN domain of SHANK3 from “split” trajectories. If the two domains are separated, mutations within the SPN domain elicit a strong increase in backbone dynamics compared to the WT, which is absent if the SPN- and ARR-domain are connected by their linker (shown in (C)). Additionally, dynamics within the WT SPN domain appear lower if the domains are split. (D) Cα backbone RMSD restricted to the ARR domain of SHANK3 from “split” trajectories. Interestingly, under these conditions ASD-associated mutations also induce a distal increase in dynamics of the ARR domain. (E) Frame overlays are shown from trajectories where the SPN- and ARR-domain have been split (every fifth frame loaded, overlay (beginning:step:end) = 0:20:20002 resulting in 1000 frames).

References

    1. Agashe VR, Udgaonkar JB. Thermodynamics of denaturation of barstar: evidence for cold denaturation and evaluation of the interaction with guanidine hydrochloride. Biochemistry. 1995;34:3286–3299. doi: 10.1021/bi00010a019. - DOI - PubMed
    1. Alexander CG, Wanner R, Johnson CM, Breitsprecher D, Winter G, Duhr S, Baaske P, Ferguson N. Novel microscale approaches for easy, rapid determination of protein stability in academic and commercial settings. Biochimica Et Biophysica Acta (BBA) - Proteins and Proteomics. 2014;1844:2241–2250. doi: 10.1016/j.bbapap.2014.09.016. - DOI - PMC - PubMed
    1. Baron MK, Boeckers TM, Vaida B, Faham S, Gingery M, Sawaya MR, Salyer D, Gundelfinger ED, Bowie JU. An architectural framework that may lie at the core of the postsynaptic density. Science. 2006;311:531–535. doi: 10.1126/science.1118995. - DOI - PubMed
    1. Blanchet CE, Spilotros A, Schwemmer F, Graewert MA, Kikhney A, Jeffries CM, Franke D, Mark D, Zengerle R, Cipriani F, Fiedler S, Roessle M, Svergun DI. Versatile sample environments and automation for biological solution X-ray scattering experiments at the P12 beamline (PETRA III, DESY) Journal of Applied Crystallography. 2015;48:431–443. doi: 10.1107/S160057671500254X. - DOI - PMC - PubMed
    1. Blanchet CE, Svergun DI. Small-angle X-ray scattering on biological macromolecules and nanocomposites in solution. Annual Review of Physical Chemistry. 2013;64:37–54. doi: 10.1146/annurev-physchem-040412-110132. - DOI - PubMed

Publication types