. 2021 Jun 8;6(11):e148103.
doi: 10.1172/jci.insight.148103.

Epithelial miR-206 targets CD39/extracellular ATP to upregulate airway IL-25 and TSLP in type 2-high asthma

Affiliations

Epithelial miR-206 targets CD39/extracellular ATP to upregulate airway IL-25 and TSLP in type 2-high asthma

Kan Zhang et al. JCI Insight. .

Abstract

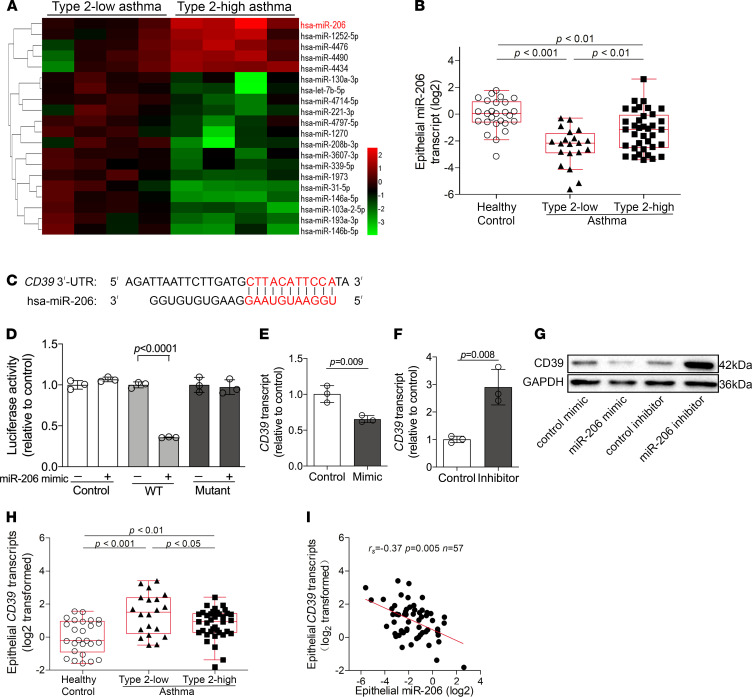
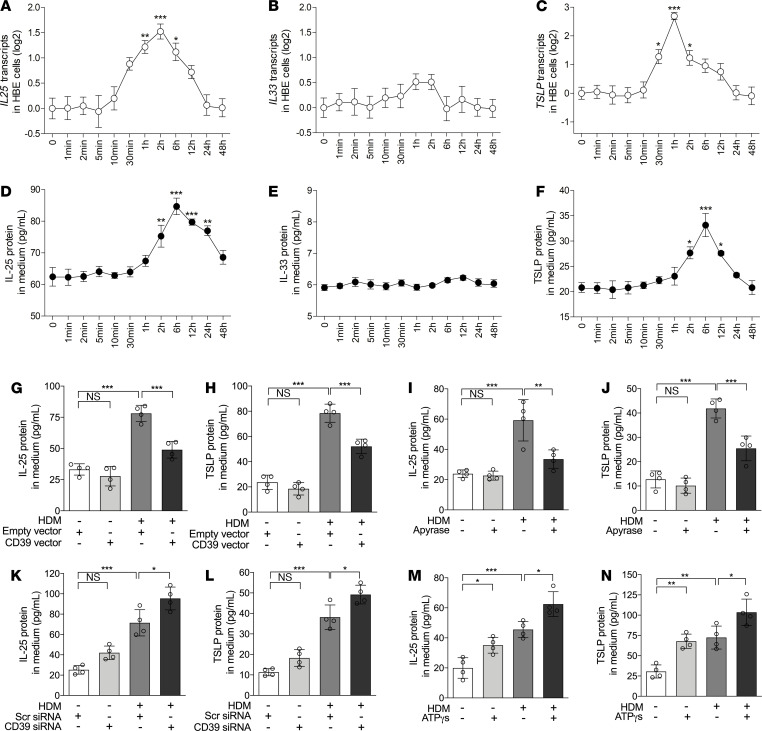
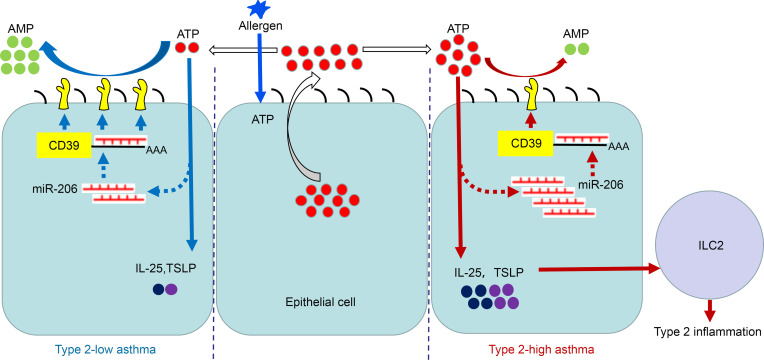
The epithelial cell-derived cytokines IL-25, IL-33, and thymic stromal lymphopoietin (TSLP) initiate type 2 inflammation in allergic diseases, including asthma. However, the signaling pathway regulating these cytokines expression remains elusive. Since microRNAs are pivotal regulators of gene expression, we profiled microRNA expression in bronchial epithelial brushings from type 2-low and type 2-high asthma patients. miR-206 was the most highly expressed epithelial microRNA in type 2-high asthma relative to type 2-low asthma but was downregulated in both subsets compared with healthy controls. CD39, an ectonucleotidase degrading ATP, was a target of miR-206 and upregulated in asthma. Allergen-induced acute extracellular ATP accumulation led to miR-206 downregulation and CD39 upregulation in human bronchial epithelial cells, forming a feedback loop to eliminate excessive ATP. Airway ATP levels were markedly elevated and strongly correlated with IL-25 and TSLP expression in asthma patients. Intriguingly, airway miR-206 antagonism increased Cd39 expression; reduced ATP accumulation; suppressed IL-25, IL-33, and Tslp expression and group 2 innate lymphoid cell expansion; and alleviated type 2 inflammation in a mouse model of allergic airway inflammation. In contrast, airway miR-206 overexpression had opposite effects. Overall, epithelial miR-206 upregulates airway IL-25 and TSLP expression by targeting the CD39-extracellular ATP axis, which represents a potentially novel therapeutic target in type 2-high asthma.

Keywords: Asthma; Pulmonology.


Conflict of interest statement

Conflict of interest: The authors have declared that no conflict of interest exists.

Figures

Figure 1
Figure 1. An epithelial miRNA differentially expressed between type 2–low and type 2–high asthma, miR-206, targets CD39.
(A) Twenty differentially expressed epithelial miRNAs between subjects with type 2–low asthma (n = 4) and type 2–high asthma (n = 4) were identified using microarrays. Each column represents data from 1 subject. Colors represent fold change relative to the mean value of type 2–low asthma. (B) miR-206 transcript levels in bronchial brushings from healthy control (n = 26), type 2–low (n = 20), and type 2–high asthma patients (n = 37) were determined by qPCR. The transcript levels are relative to the median of healthy controls and log2 transformed. Data represent medians with IQRs (1-way ANOVA with Bonferroni’s post hoc test). (C) The 3′-UTR of CD39 contains a region that matches the seed sequence of hsa–miR-206. (D) 3′-UTR luciferase reporter assay with vector harboring WT, mutant CD39 3′-UTR, or no 3′-UTR (control) cotransfected with miR-206 mimic or nontargeting control. Luciferase activity was measured with a dual-luciferase reporter assay system. The firefly luciferase activity was normalized to Renilla luciferase activity. n = 3 per group. (E and F) CD39 transcript levels in BEAS-2B cells after transfection with miR-206 mimic (E) or inhibitor (F) were determined by qPCR. The transcript levels are relative to the mean value of control group (2-tailed Student’s t test). n = 3 per group. The data are represented as mean ± SD. (G) CD39 protein expression in BEAS-2B cells after transfection with miR-206 mimic and inhibitor was determined by Western blotting. (H) CD39 transcript levels in bronchial brushings from healthy control (n = 26), type 2–low asthma (n = 20), and type 2–high asthma patients (n = 37) were determined by qPCR. Data are expressed and compared as in B. (I) Spearman’s rank order correlation assay between epithelial CD39 and miR-206 transcript levels in all asthma patients (n = 57).
Figure 2
Figure 2. Acute extracellular ATP accumulation is responsible for allergen-induced miR-206 downregulation and CD39 upregulation in bronchial epithelial cells.
(A) ATP levels in BALF from healthy control (n = 26), type 2–low (n = 20), and type 2–high asthma patients (n = 37) were determined by luciferase bioluminescence. Data are expressed as median values withIQRs. The lines within the boxes represent medians, and the bounds of the boxes represent IQRs. The whiskers are plotted using Tukey method. One-way ANOVA with Bonferroni’s post hoc test was performed. (B) ATP concentration in culture medium collected at indicated time points after HDM stimulation was measured using luciferase bioluminescence. (C and D) Transcript levels of miR-206 (C) and CD39 (D) in HBE cells harvested at the indicated time points after HDM stimulation were determined by qPCR. n = 4 wells per time point combined from 2 experiments using HBE cells from 2 healthy donors. The data are represented as mean ± SD. *P < 0.05; **P < 0.01; ***P < 0.001 (1-way ANOVA with Bonferroni’s post hoc test). (E and F) miR-206 transcript levels in HBE cells pretreated with apyrase or saline for 2 hours before addition of HDM and stimulation for 6 hours (E), and treated with ATPγS or saline with or without HDM for 6 hours (F). (G and H) CD39 transcript levels in HBE cells pretreated with apyrase or saline for 2 hours before addition HDM and stimulation for 6 hours (G), and treated with ATPγS or saline with or without HDM for 6 hours (H). The transcript levels are relative to the mean value of control group and log2 transformed. n = 4 wells per group combined from 2 experiments using HBE cells from 2 healthy donors. The data are represented as mean ± SD. *P < 0.05; **P < 0.01; ***P < 0.001 (1-way ANOVA with Bonferroni’s post hoc test).
Figure 3
Figure 3. Airway IL-25 and TSLP expression is elevated in type 2–high asthma and correlated with BALF ATP levels.
(AC) The transcripts of IL25 (A), IL33 without exons 3 and 4 (B), and the long isoform of TSLP (C) in bronchial epithelial brushings from healthy control (n = 26), type 2–low (n = 20), and type 2–high asthma patients (n = 37) were determined using qPCR with TaqMan primers and probes. For detection of IL33 transcripts without exons 3 and 4, RNase H–dependent qPCR was performed. The transcript levels are relative to the median value of healthy controls and log2 transformed. (DF) IL-25 (D), IL-33 (E), and TSLP (F) protein levels in BALF from healthy control (n = 26), type 2–low (n = 20), and type 2–high asthma patients (n = 37) were determined using ELISA. Data are expressed as median values with IQRs. The lines within the boxes represent medians, and the bounds of the boxes represent IQRs. The whiskers are plotted using Tukey method. One-way ANOVA with Bonferroni’s post hoc test was performed. (G and H) Spearman’s rank order correlation assays between BALF ATP levels and BALF IL-25 protein levels (G) and TSLP protein levels (H).
Figure 4
Figure 4. Extracellular ATP is required and sufficient for IL-25 and TSLP expression in bronchial epithelial cells.
(AC) The transcripts of IL25 (A), IL33 without exons 3 and 4 (B), and the long isoform of TSLP (C) in HBE cells harvested at the indicated time points after HDM stimulation were determined by qPCR. (DF) IL-25 (D), IL-33 (E), and TSLP (F) protein levels in culture medium collected at the indicated time points after HDM stimulation were determined using ELISAs. n = 4 wells per time points combined from 2 experiments using HBE cells from 2 healthy donors. Data are mean ± SD. *P < 0.05; **P < 0.01; ***P < 0.001 (1-way ANOVA with Bonferroni’s post hoc test). (G and H) IL-25 (G) and TSLP (H) protein levels in culture medium after transfection with empty or CD39 expression vector and stimulation with or without HDM for 6 hours were determined using ELISAs. (I and J) IL-25 (I) and TSLP (J) protein levels in culture medium after pretreatment with apyrase or saline and stimulation with or without HDM for 6 hours were determined using ELISAs. (K and L) IL-25 (K) and TSLP (L) protein levels in culture medium after transfection with scrambled or CD39 siRNA and stimulation with or without HDM for 6 hours were determined using ELISAs. (M and N) IL-25 (M) and TSLP (N) protein levels in culture medium after treatment with ATPγS or saline and with or without HDM for 6 hours were determined using ELISAs. n = 4 wells per group combined from 2 experiments using HBE cells from 2 healthy donors. Data are mean ± SD. *P < 0.05; **P < 0.01; ***P < 0.001 (1-way ANOVA with Bonferroni’s post hoc test).
Figure 5
Figure 5. Epithelial miR-206 targets the CD39–extracellular ATP axis in a murine model of allergic airway inflammation.
(A) Experimental schedule. (B) The seed region of mmu–miR-206-3p, and the seed recognizing sites in the 3′-UTR of mouse Cd39 variant 1 (position 2864–2869) are shown. (CE) miR-206 (C) and Cd39 (D) transcript levels in the lungs and ATP levels in BALF (E) were determined by qPCR and luciferase bioluminescence, respectively, in mice intranasally administered control or miR-206 antagomir and challenged with HDM or saline. (FH) miR-206 (F) and Cd39 (G) transcript levels in the lungs and ATP levels in BALF (H) were determined by qPCR and luciferase bioluminescence, respectively, in mice intranasally administered control or miR-206 agomir and challenged with HDM or saline. The transcript levels are relative to the mean value of the control group and log2 transformed. n = 6–10 mice per group combined from 2 independent experiments. The data are represented as mean ± SD. *P < 0.05; **P < 0.01; ***P < 0.001 (1-way ANOVA with Bonferroni’s post hoc test). (I and J) Representative images of in situ hybridization of miR-206 (I) and IHC of CD39 (J) in lung sections from mice intranasally administered control or miR-206 agomir and challenged with HDM or saline. Scale bar: 50 μm.
Figure 6
Figure 6. Airway miR-206 antagonism suppresses HDM-induced AHR, airway inflammation, mucus overproduction, and the type 2 response in mice.
(A) Respiratory resistance in response to different concentrations of i.v. acetylcholine at 24 hours after the last HDM or saline challenge in mice intranasally administered with control or miR-206 antagomir. (B) Inflammatory scores of lung sections from mice intranasally administered with control or miR-206 antagomir and challenged with HDM or saline were calculated as described in Methods. (C) Counts of macrophages, eosinophils, lymphocytes, and neutrophils in BALF. (D) H&E staining of representative lung sections. (E) PAS staining for mucus in representative lung sections. (F) The number of PAS+ cells was counted in 4 random fields for each lung section at ×200 magnification. (G) Muc5ac transcript levels in mice lung were determined by qPCR. The transcript levels are relative to the mean value of the control group and log2 transformed. (HJ) The protein levels of IL-4 (H), IL-5 (I), and IL-13 (J) in BALF were determined using ELISAs. (K) Plasma IgE levels in peripheral blood were determined using ELISAs. n = 6–10 mice per group combined from 2 independent experiments. The data are represented as mean ± SD. *P < 0.05; **P < 0.01; ***P < 0.001 (1-way ANOVA with Bonferroni’s post hoc test). Scale bar: 50 μm.
Figure 7
Figure 7. Perturbation of airway miR-206 expression alters HDM-induced IL-25, IL-33, Tslp expression and ILC2 expansion in mouse lung.
(AC) IL-25 (A), IL-33 (B), and Tslp (C) protein levels in BALF were determined using ELISAs in mice intranasally administered with control or miR-206 antagomir and challenged with HDM or saline. (DF) IL-25 (D), IL-33 (E), and Tslp vprotein levels in BALF were determined using ELISAs in mice intranasally administered control or miR-206 agomir and challenged with HDM or saline. n = 6–10 mice per group combined from 2 independent experiments. (G) Single-cell suspensions of mouse lung tissue were incubated with a cocktail of biotin-conjugated antibodies for detection of lineage markers and mixed with anti-Biotin microbeads to isolate lineage lung cells. ILC2s in mouse lungs were enumerated via flow cytometry analysis with lineage lung cells using the following gating strategy: live, single, CD25+CD127+ST2+Sca-1+ cells. (H and J) Representative flow cytometric plots (H) and numbers of ILC2s (J) in the lungs of mice intranasally administered control or miR-206 antagomir and challenged with HDM or saline. (I and K) Representative flow cytometric plots (I) and numbers of ILC2s (K) in the lungs of mice intranasally administered control or miR-206 agomir and challenged with HDM or saline. n = 6–9 per group, combined from 2 experiments. The data are represented as mean ± SD. *P < 0.05; **P < 0.01; ***P < 0.001 (1-way ANOVA with Bonferroni’s post hoc test).
Figure 8
Figure 8. Scheme illustrating for the signaling pathway regulating IL-25 and TSLP expression in airway epithelial cells in type 2–low and type 2–high asthma.
Allergens stimulate rapid release of ATP from epithelial cells. Extracellular ATP serves as an alarmin to induce expression of the innate cytokines IL-25 and TSLP. Meanwhile, acute accumulation of extracellular ATP decreases epithelial miR-206 expression, which upregulates CD39 expression to eliminate excessive ATP. Epithelial miR-206 is decreased in both type 2–low and type 2–high asthma. Compared with type 2–low asthma, less reduction in epithelial miR-206 results in higher miR-206 level, lower CD39 expression, and impaired capacity to eliminate extracellular ATP in type 2–high asthma. Consequently, more extracellular ATP accumulates, which leads to higher expression of IL-25 and TSLP and more prominent type 2 inflammation in type 2–high asthma.

Similar articles

Cited by

References

    1. Wenzel SE. Asthma phenotypes: the evolution from clinical to molecular approaches. Nat Med. 2012;18(5):716–725. doi: 10.1038/nm.2678. - DOI - PubMed
    1. Agache I, Akdis CA. Precision medicine and phenotypes, endotypes, genotypes, regiotypes, and theratypes of allergic diseases. J Clin Invest. 2019;129(4):1493–1503. doi: 10.1172/JCI124611. - DOI - PMC - PubMed
    1. Woodruff PG, et al. T-helper type 2-driven inflammation defines major subphenotypes of asthma. Am J Respir Crit Care Med. 2009;180(5):388–395. doi: 10.1164/rccm.200903-0392OC. - DOI - PMC - PubMed
    1. Peebles RS, Jr , Aronica MA. Proinflammatory pathways in the pathogenesis of asthma. Clin Chest Med. 2019;40(1):29–50. doi: 10.1016/j.ccm.2018.10.014. - DOI - PMC - PubMed
    1. Hammad H, Lambrecht BN. Barrier epithelial cells and the control of type 2 immunity. Immunity. 2015;43(1):29–40. doi: 10.1016/j.immuni.2015.07.007. - DOI - PubMed

Publication types

MeSH terms