. 2021 Jun 8;6(11):e148425.
doi: 10.1172/jci.insight.148425.

Molecular signatures of labor and nonlabor myometrium with parsimonious classification from 2 calcium transporter genes

Affiliations

Molecular signatures of labor and nonlabor myometrium with parsimonious classification from 2 calcium transporter genes

William E Ackerman 4th et al. JCI Insight. .

Abstract

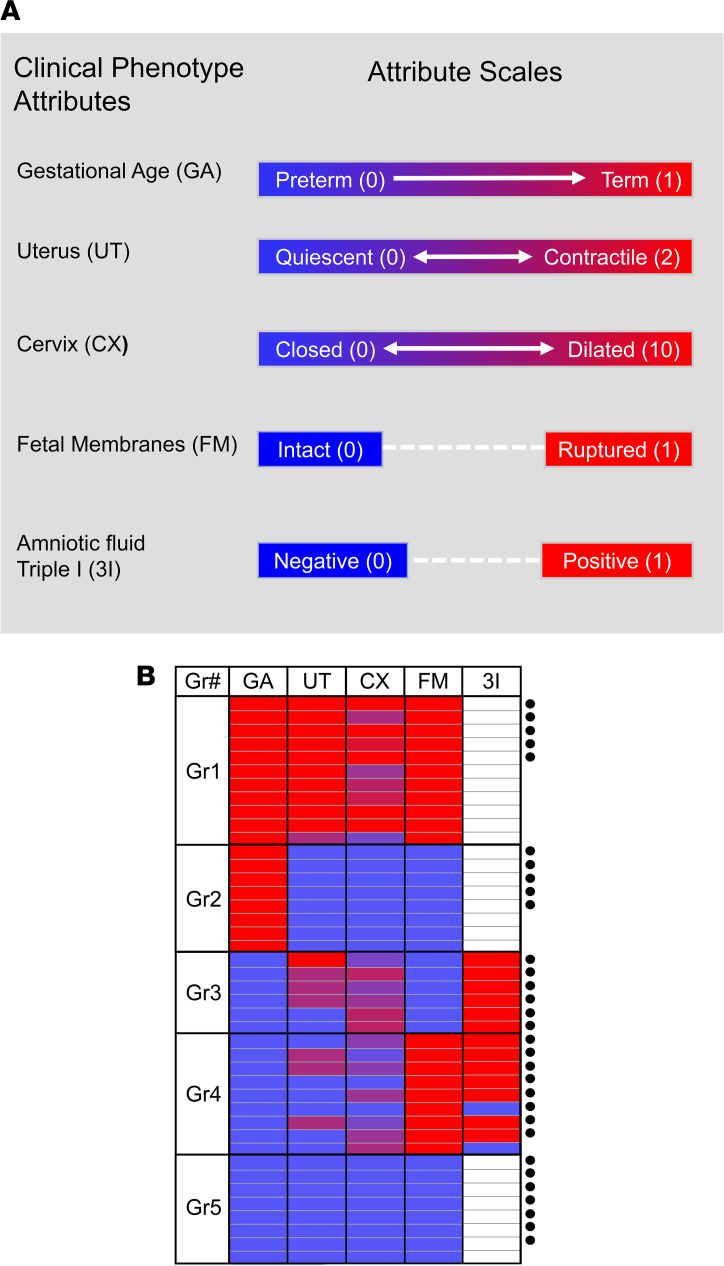
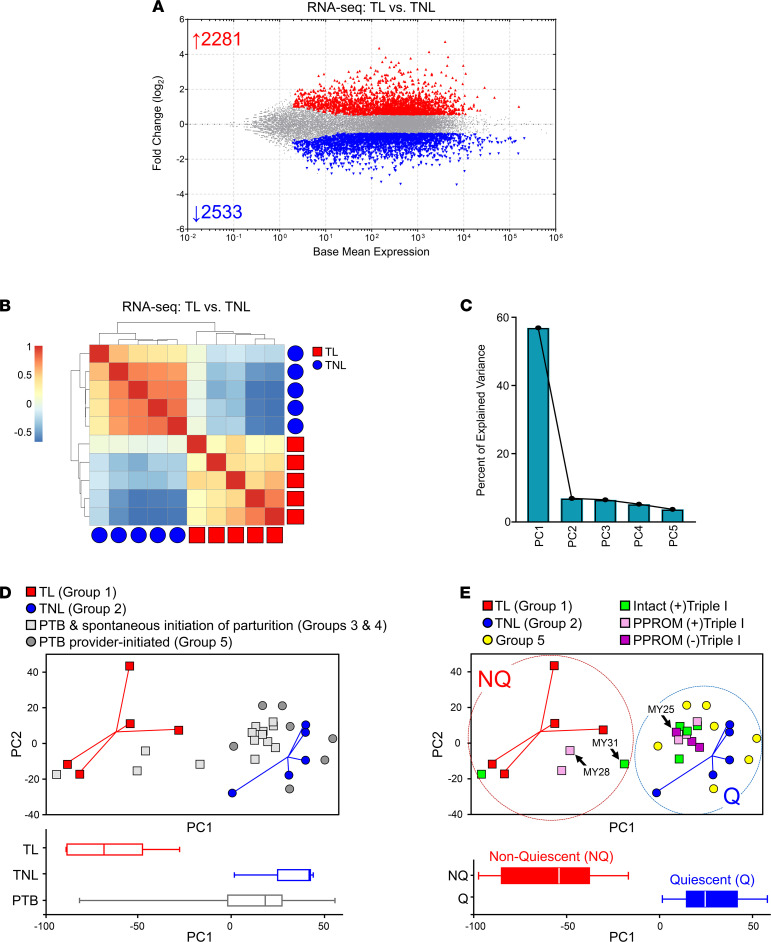
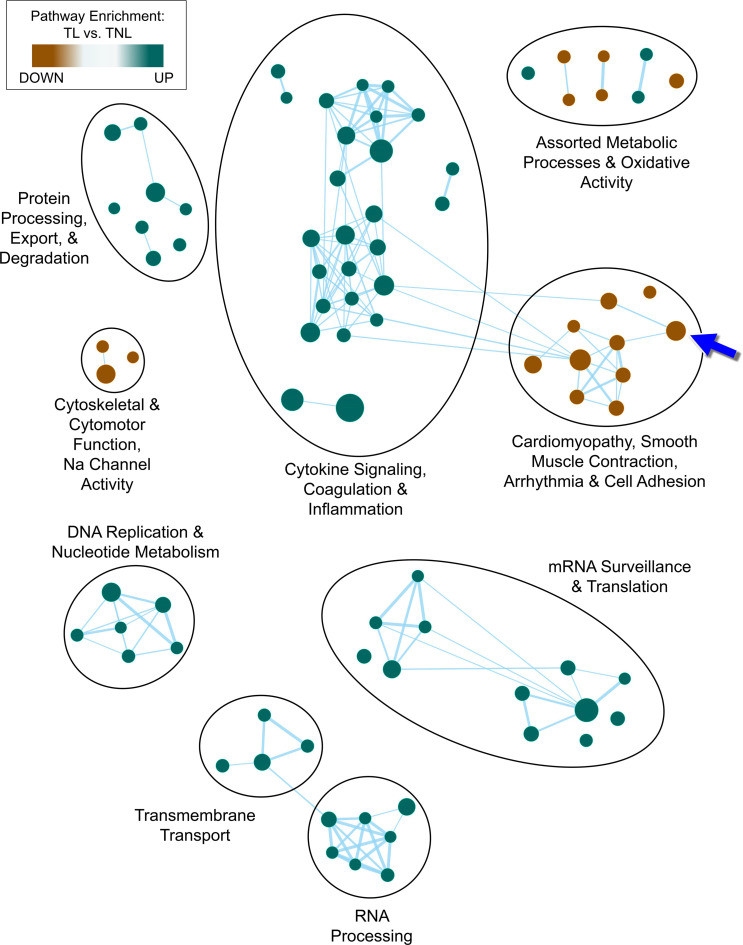
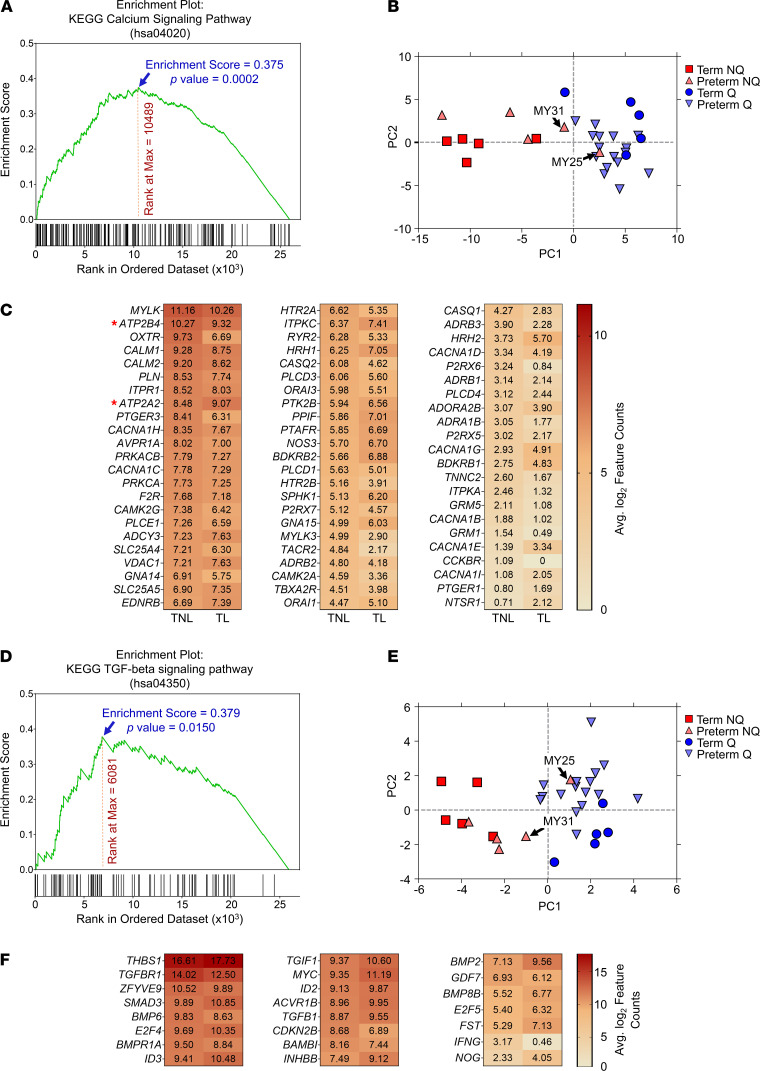
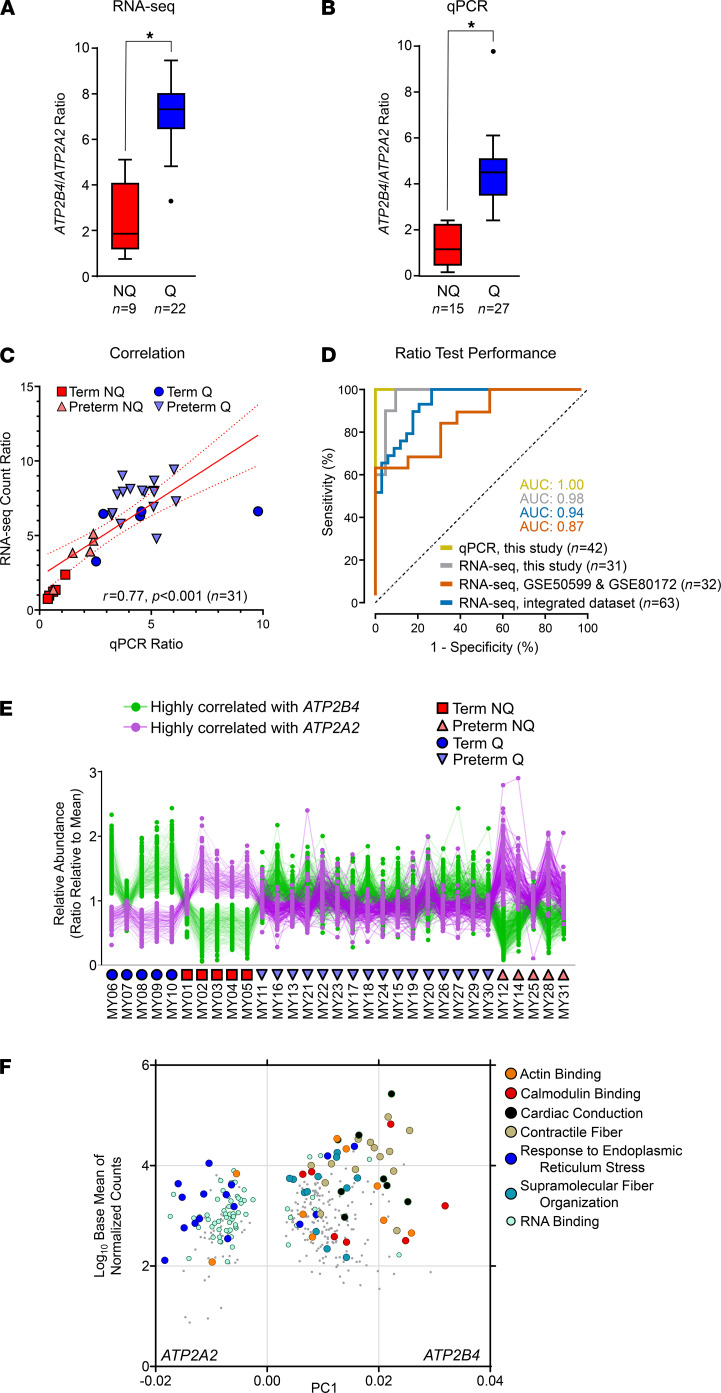
Clinical phenotyping of term and preterm labor is imprecise, and disagreement persists on categorization relative to underlying pathobiology, which remains poorly understood. We performed RNA sequencing (RNA-seq) of 31 specimens of human uterine myometrium from 10 term and 21 preterm cesarean deliveries with rich clinical context information. A molecular signature of 4814 transcripts stratified myometrial samples into quiescent (Q) and nonquiescent (NQ) phenotypes, independent of gestational age and incision site. Similar stratifications were achieved using expressed genes in Ca2+ signaling and TGF-β pathways. For maximal parsimony, we evaluated the expression of just 2 Ca2+ transporter genes, ATP2B4 (encoding PMCA4) and ATP2A2 (coding for SERCA2), and we found that their ratio reliably distinguished NQ and Q specimens in the current study, and also in 2 publicly available RNA-seq data sets (GSE50599 and GSE80172), with an overall AUC of 0.94. Cross-validation of the ATP2B4/ATP2A2 ratio by quantitative PCR in an expanded cohort (by 11 additional specimens) achieved complete separation (AUC of 1.00) of NQ versus Q specimens. While providing additional insight into the associations between clinical features of term and preterm labor and myometrial gene expression, our study also offers a practical algorithm for unbiased classification of myometrial biopsies by their overall contractile program.

Keywords: Expression profiling; Reproductive Biology.


Conflict of interest statement

Conflict of interest: The authors have declared that no conflict of interest exists.

Figures

Figure 1
Figure 1. Overview of clinical characteristics of myometrial samples.
(A) Graphical summary of clinical phenotypic attributes included as part of the classification algorithm used in this study. Gestational age was established clinically based on last menstrual period and/or ultrasonographic examination prior to 20 weeks (wk) of gestation and dichotomized into term (1, delivery > 37 wk of gestation) and preterm (0, delivery < 34 wk of gestation) cases. Uterine contractions were scored semiquantitatively on a scale from 0 to 2 (0, absent; 1, irregular, not followed by cervical change or when contractions receded after tocolysis; or 2, regular and followed by cervical change). Cervical dilation was scored on a scale from 0 to 10 cm as recorded on the last exam prior to cesarean. Membrane status was scored as 0 (intact) or 1 (ruptured). Triple I was scored as 0 (absent) or 1 (confirmed or suspected). (B) Heatmap of clinical characteristics for all cases included in the current study. Cases were aggregated into 5 groups as follows: Gr1, term birth following spontaneous onset of term labor (TL); Gr2, term birth by elective cesarean section not in labor (TNL); Gr3, PTB following spontaneous preterm labor with intact membranes (PTB-sPTL); Gr4, PTB following PPROM (PTB-PPROM); and Gr5, provider-initiated PTB in the absence of active labor contractions, cervical dilation, or membrane rupture (PTB-PI). Additional phenotyping of cases spontaneously committed to PTBs (Gr3 and Gr4) involved presence or absence of Triple I based on cultures of amniotic fluid obtained via clinically indicated amniocentesis as described in prior studies. The circular symbols to the right of the image denote samples that were included in the exploratory phase of the study.
Figure 2
Figure 2. Differentially expressed RNA transcripts in myometrial specimens in term and preterm labor.
(A) Plot of log2 ratio to average baseline (TNL) expression for the 4814 transcripts differentially abundant (FDR < 0.1, minimum fold-change ± 1.5, DESeq2 algorithm) between term myometrial specimens in the absence (TNL, n = 5) or presence (TL, n = 5) of labor. Transcripts with increased abundance are depicted in red, while those with decreased levels are shown in blue. (B) Correlation matrix with unsupervised hierarchical cluster analysis showing a higher degree of similarity among samples within each cohort (blue circles, TNL; red squares, TL) than between cohorts when considering the differentially abundant transcripts. (C) Scree plot of principal components following application of PCA to the differentially expressed genes in term myometrial specimens. The first principal component, PC1, accounted for most (57%) of the explained variance in the data. (D) Scatterplot of PC1 and PC2 with accompanying box-and-whisker plots (below) showing the distribution of TL (red squares), TNL (blue circles), and preterm birth (PTB, gray symbols) in PC space based on the expression signature of 4184 transcripts. Spontaneous initiation of PTB is denoted by light gray boxes, while dark gray circles indicate the absence of spontaneous labor initiation as determined clinically. (E) Scatterplot as in D but recolored to indicate in greater detail the clinical disposition of the pregnancies from which the PTB myometrial specimens were derived: intact membranes with Triple I (green squares); intact membranes without Triple I (Group 5, PTB-PI, yellow circles); preterm premature rupture of membranes (PPROM) with Triple I (pink squares); and PPROM without Triple I (purple squares). Two clusters comprising mostly nonquiescent (NQ) and quiescent (Q) myometrial specimens were evident (dashed circles). PTB cases with complex mixed phenotypes (MY25 and MY28), as well as a NQ specimen (MY31) that distributed between the term specimen clusters, are indicated.
Figure 3
Figure 3. Characteristics of the transcriptional landscape differentiating the quiescent (Q) and nonquiescent (NQ) molecular phenotypes.
Enrichment map of gene sets exhibiting significant enrichment by the GSEA algorithm (P < 0.005, FDR < 0.1) based on the transcriptional expression signature in myometrial samples. Markov cluster analysis was used to identify 9 dense subclusters within the network, indicated by the labeled ellipses. Within the network diagram, node size reflects the number of genes in each enriched set, node color indicates the direction of enrichment, and edges represent the overlap coefficient between adjacent nodes as a similarity metric. The blue arrow indicates the KEGG calcium signaling pathway within a subnetwork enriched for Ca2+ binding and Ca2+ transport genes.
Figure 4
Figure 4. Myometrial nonquiescence is associated with potential dysregulation of Ca2+ signaling and TGF-β pathways.
(A) Gene set enrichment plot for the 183 transcripts related to the KEGG calcium signaling pathway. For this analysis, gene expression ranking in the TL versus TNL comparison was done by the adjusted P value (FDR) as determined using the DESeq2 algorithm, and statistical enrichment for the gene set was determined using 1000 gene list permutations. (B) Scatterplot of the top 2 principal components following dimensionality reduction of differentially abundant calcium signaling transcripts. TNL specimens are indicated by blue circles, TL samples are indicated by red squares, and preterm NQ (nonquiescent phenotype) and Q (quiescent phenotype) specimens are depicted by light red and light blue triangles, respectively. (C) Heatmap of average, log2-transformed, normalized RNA-seq feature counts for the 68 calcium signaling transcripts exhibiting significant differences in abundance between the TL and TNL myometrial samples (FDR < 0.1, fold-change of at least ± 1.5). Asterisks denote the 2 mRNAs encoding calcium transporter proteins selected for more detailed analysis: ATP2B4 and ATP2A2. Note that a difference between 2 values, ab, in the log2-transformed data corresponds to a linear difference of 2a – 2b. (D) Gene set enrichment plot for the 84 transcripts related to the TGF-β signaling KEGG pathway, conducted as described above. (E) Scatterplot of the dominant principal components following PCA applied to differentially abundant TGF-β pathway transcripts. Sample annotation is equivalent to that in B. (F) Heatmap of the average normalized RNA-seq feature counts (log2-scaled) for the 23 TGF-β pathway genes that differed significantly between the TL and TNL myometrial samples (FDR < 0.1, minimum fold-change ± 1.5).
Figure 5
Figure 5. The expression ratio of 2 anticorrelated calcium transporter genes reliably distinguishes myometrial quiescence from the nonquiescent phenotype.
(A) Box and whisker plots (box, median with IQR; whiskers, inner fences using Tukey’s method) showing expression ratios of transcripts encoding ATP2B4 and ATP2B2 as determined by RNA-seq (Q, quiescent phenotype, n = 22; NQ, nonquiescent phenotype, n = 9). Asterisk indicates statistical significance (P < 0.001, Mann-Whitney U test). (B) Box and whisker plots (as in A) showing qPCR expression ratios of ATP2B4/ATP2B2, stratified by phenotype (Q, n = 27; NQ, n = 15). Asterisk indicates statistical significance (P < 0.001, Mann-Whitney U test). (C) Scatterplot showing the extent of correlation between ATP2B4/ATP2B2 expression ratios determined using RNA-seq and qPCR in 31 samples (r = 0.76, P < 0.001). TNL specimens are indicated by blue circles, TL samples are indicated by red squares, and preterm NQ and Q specimens are depicted by light red and light blue triangles, respectively. (D) ROC curve analysis applied to binary classification of NQ and Q specimens based on expression ratios of ATP2B4/ATP2B2 calculated either by qPCR (for samples from the current study) or RNA-seq (for samples from the current study, samples from prior published studies [GSE50599, n = 10; and GSE80172, n = 22], and an integrated data set comprising samples from the current study and the 2 existing data sets). All AUC values achieved statistical significance (P < 0.001). (E) Relative abundances of transcripts with expression highly correlated (r ≥ 0.95) with ATP2B4 (233 transcripts, green) or ATP2A2 (121 transcripts, purple). TNL specimens are indicated by blue circles, TL samples are indicated by red squares, and preterm NQ and Q specimens are depicted by light red and light blue triangles, respectively. (F) Overrepresented pathways for transcripts in E, plotted by average log10-scaled baseline expression in Q (term and preterm) specimens, and projection of transcript along PC1 in principle component analysis.

Similar articles

Cited by

References

    1. Norwitz ER, et al. Physiology of parturition. In: Resnik R, Lockwood CJ, eds. Creasy and Resnik’s Maternal-Fetal Medicine: Principles and Practice, 8th ed. Elsevier; 2019:81–95.
    1. Kuba K, Bernstein PS. ACOG practice bulletin no. 188: prelabor rupture of membranes. Obstet Gynecol. 2018;131(6):1163–1164. - PubMed
    1. Barros FC, et al. The distribution of clinical phenotypes of preterm birth syndrome: implications for prevention. JAMA Pediatr. 2015;169(3):220–229. doi: 10.1001/jamapediatrics.2014.3040. - DOI - PubMed
    1. Simhan HN, et al. Prevention and management of preterm parturition. In: Resnik R, Lockwood CJ, eds. Creasy and Resnik’s Maternal-Fetal Medicine: Principles and Practice, 8th ed. Elsevier; 2019:679–711.
    1. Buhimschi CS, et al. Pathogenesis of spontaneous preterm birth. In: Resnik R, Lockwood CJ, eds. Creasy and Resnik’s Maternal-Fetal Medicine: Principles and Practice, 8th ed. Elsevier; 2019:96–126.

Publication types

MeSH terms

Substances

Supplementary concepts