. 2021 Jun 15;131(12):e135763.
doi: 10.1172/JCI135763.

DSCAM/PAK1 pathway suppression reverses neurogenesis deficits in iPSC-derived cerebral organoids from patients with Down syndrome

Affiliations

DSCAM/PAK1 pathway suppression reverses neurogenesis deficits in iPSC-derived cerebral organoids from patients with Down syndrome

Xiao-Yan Tang et al. J Clin Invest. .

Abstract

Down syndrome (DS), caused by trisomy of chromosome 21, occurs in 1 of every 800 live births. Early defects in cortical development likely account for the cognitive impairments in DS, although the underlying molecular mechanism remains elusive. Here, we performed histological assays and unbiased single-cell RNA-Seq (scRNA-Seq) analysis on cerebral organoids derived from 4 euploid cell lines and from induced pluripotent stem cells (iPSCs) from 3 individuals with trisomy 21 to explore cell-type-specific abnormalities associated with DS during early brain development. We found that neurogenesis was significantly affected, given the diminished proliferation and decreased expression of layer II and IV markers in cortical neurons in the subcortical regions; this may have been responsible for the reduced size of the organoids. Furthermore, suppression of the DSCAM/PAK1 pathway, which showed enhanced activity in DS, using CRISPR/Cas9, CRISPR interference (CRISPRi), or small-molecule inhibitor treatment reversed abnormal neurogenesis, thereby increasing the size of organoids derived from DS iPSCs. Our study demonstrates that 3D cortical organoids developed in vitro are a valuable model of DS and provide a direct link between dysregulation of the DSCAM/PAK1 pathway and developmental brain defects in DS.

Keywords: Embryonic stem cells; Neurodevelopment; Neuroscience; Stem cells; iPS cells.


Conflict of interest statement

Conflict of interest: The authors have declared that no conflict of interest exists.

Figures

Figure 1
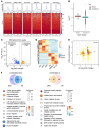
Figure 1. Single-cell transcriptional profiling of cerebral organoids derived from trisomy 21 and euploid hPSC lines.
(A) Schematic illustrating the generation and analysis of cerebral organoids from trisomy 21 and euploid (n = 3 human iPSC lines from individuals with trisomy 21; n = 4 euploid hPSC lines). D30, day 30; D70, day 70. (B) Immunofluorescence analysis of cerebral organoids 30 days after the initiation of differentiation shows the proliferation marker Ki67 (red), the early-born neuron marker CTIP2, and the adherens junction marker PKCλ (gray) in trisomy 21 and euploid organoids. HO, Hoechst staining. Scale bar: 50 μm. (C) Immunostaining for the neural progenitor marker SOX1 (red), the newborn neuron marker DCX (green), and the mitotic marker PHH3 (gray) on day 30 of differentiation in trisomy 21 and euploid organoids. Scale bar: 50 μm. (D) Representative images of organoids showing the neuronal marker TUJ1 (red) and the M-phase marker p-vimentin (gray). Scale bar: 50 μm. (E) UMAP plot of cell types detected in euploid (n = 5) and trisomy (n = 4) organoids. Cyc, cycling; RG, radial glial cells; IPC, intermediate progenitor cells; Glu, glutamatergic neurons; immature IN, immature inhibitory neurons; N-C N, noncommitted neurons. (F) VoxHunt spatial brain mapping of all the clusters in the cerebral organoids onto data from E13.5 mouse brains from the Allen Brain Institute. Coronal sections are shown with scaled similarity scores. Max, maximum. (G) Transcriptome correlation between day-30 organoids and developing neocortex samples from the BrainSpan project (pcw 8–16). The mean Spearman’s correlation coefficients (r) are indicated. (H) Developmental trajectories of the major cell types detected in day-30 trisomy 21 and euploid organoids. (I) Distributions of glutamatergic neurons in trisomy and euploid organoids over pseudotime. (J) GO analysis of DEGs across all cell types between trisomy 21 and euploid organoids. Selected GO terms with a FDR of less than 0.05 are shown. NSC, neural stem cell.
Figure 2
Figure 2. Transcriptional and ATAC-Seq analyses in cerebral organoids derived from trisomy 21 and euploid PSCs.
(A) Heatmaps of regions that are differentially accessible between trisomy 21 and euploid cells at promoter regions on chromosome 21. (B) Box plots for a log2 fold change of OCRs among chromosome 21 (chr21) and other chromosomes (nonchr21). (C) Volcano plot of differential ATAC peaks in trisomy 21 cerebral organoids. Differential ATAC peaks were identified by DESeq2. The color intensity represents the density of the points in the volcano plot. Increased ATAC sites are shown in orange (log2 fold change >1 and P < 0.05, n = 1785), and decreased ATAC sites are shown in blue (log2 fold change <–1 and P < 0.05, n = 1695). (D) Heatmap of transcriptome analysis shows 193 significantly DEGs in trisomy 21 organoids compared with euploid control organoids with a fold change of greater than 2 and q value of less than 0.05. DA, differentially accessible. (E) Correlations between gene expression (log2 fold change) and chromatin accessibility (log2 fold change). Pearson’s correlation coefficient r = 0.165. (F) GO analysis of the genes showing coordinately altered expression and accessibility between trisomy 21 and euploid organoids.
Figure 3
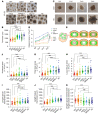
Figure 3. Reduced size and expansion rates of organoids from patients with DS.
(A) Bright-field microscopic images of trisomy 21 and euploid EBs on day 7. Scale bar: 250 μm. (B) Quantification of EB perimeters on day 7. At least 25 EBs were analyzed for each cell line; n ≥3 independent experiments. Data represent the mean ± SEM. ***P < 0.001, by 1-way ANOVA followed by Dunnett’s multiple-comparison test. (C) Bright-field microscopic images of trisomy 21 and euploid organoids at different developmental time points. Scale bar: 250 μm. (D) Quantification of the organoid area of trisomy 21 and euploid organoids on days 9, 12, 15, and 17 after differentiation reflected a reduction in the expansion rate of trisomy 21 organoids compared with euploid organoids. Organoids (n ≥16) from 3 independent biological replicate experiments were analyzed for each cell line. Data represent the mean ± SEM. ****P < 0.0001, by 2-way ANOVA followed by Sidak’s multiple-comparison test. (E) Schematic overview of the different parameters of neuroepithelial loops in organoids 30 days after the induction of differentiation. Shown are loop tissue area (top middle), total loop area (top right), ventricle area (bottom left), basal membrane length (bottom middle), and apical membrane length (bottom right). (FK) Quantification of a series of parameters in neuroepithelial loops of trisomy 21 and euploid organoids on day 30. Organoids (n ≥16) from 3 independent biological replicate experiments were analyzed for each cell line. Data represent the mean ± SEM. ***P < 0.001, by 1-way ANOVA followed by Dunnett’s multiple-comparison test.
Figure 4
Figure 4. Proliferation studies of day-30 cerebral organoids.
(AD) Immunofluorescence of Ki67+, EdU+, SOX2+, and PAX6+ proliferating radial glial progenitors, mature MAP2+, TUJ1+ neurons, and deep-layer VI TBR1+ excitatory neurons after 30 days of differentiation. Scale bar: 20 μm. (EH) Quantification of the proportion of Ki67+, SOX2+, PAX6+, and EdU+ cells in trisomy 21 and euploid organoids after 30 days of differentiation. n = 15–42 VZ-like regions in at least 5 organoids per cell line. Data represent the mean ± SEM. *P < 0.05, **P < 0.01, and ***P < 0.001, by 1-way ANOVA followed by Dunnett’s multiple-comparison test.
Figure 5
Figure 5. Neurogenesis studies of cerebral organoids.
(A) Schematic illustrating the single-cell transcriptomic and histological analysis of trisomy 21 and euploid organoids. (B) UMAP visualization of scRNA expression in glutamatergic neuron subclusters of trisomy 21 and euploid organoids after 70 days of in vitro differentiation. Chart on the right shows the comparisons of cell composition between the trisomy 21 and euploid organoids after 70 days of differentiation. DL, deep layer; UL, upper layer. (C) Average expression (avg.exp.) levels of representative markers in each glutamatergic neuron subcluster are shown according to scaled expression scores. (D) Histogram of the log2 fold change of average expression levels and percentage (pct.) of expression for significantly different genes in the glutamatergic neuron subcluster. (E) Images show decreased maturation of CTIP2+ neurons on day 70 in trisomy 21 organoids compared with euploid organoids. Scale bar: 50 μm. (F) Quantification of the proportion of CTIP2+ cells in both trisomy and euploid organoids on day 70. n = 13–20 neural tube–like regions in at least 5 organoids per cell line. Data represent the mean ± SEM. ***P < 0.001, by Student’s t test. (G) Images show decreased maturation of SATB2+ neurons on day 70 in trisomy 21 organoids compared with euploid organoids. Scale bar: 25 μm. (H) Quantification of the proportion of SATB2+ cells in trisomy and euploid organoids on day 70. n = 9–11 neural tube–like regions in at least 5 organoids per cell line. Data represent the mean ± SEM. **P < 0.01, by Student’s t test.
Figure 6
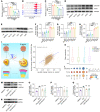
Figure 6. DSCAM-KD rescues impaired DSCAM/PAK1 signaling in DS-derived cortical cultures.
(A) Relative expression levels of DSCAM in day-30 trisomy 21 and euploid organoids as assessed by qPCR. (B) Coverage maps of normalized ATAC-Seq signals from trisomy 21 and euploid organoids showing a differentially accessible (DA) peak near the DSCAM gene on chromosome 21. (C) Relative mRNA expression levels of PAK1 in day-30 trisomy 21 and euploid organoids as assessed by qPCR. (D and E) Detection of DSCAM, PAK1, and p-PAK1 expression in trisomy 21 and euploid organoids on day 30, as assessed by Western blotting. (FH) Representative quantitation of relative DSCAM, PAK1, and p-PAK1 protein expression in trisomy 21 and euploid organoids. n ≥3 independent experiments. Data represent the mean ± SEM. ***P < 0.001, by 1-way ANOVA followed by Dunnett’s multiple-comparison test. (I) Schematic diagram illustrating the effects of DSCAM KD on proliferation and neurogenesis in trisomy 21 and euploid cerebral organoids. (J) Correlations of the changes in expression between trisomy 21 organoids and DSCAM-KD organoids and between trisomy 21 organoids and euploid organoids. Spearman’s correlation coefficient: r = 0.39. (K) Box plot showing the average expression level of the trisomy 21–associated DEGs that were downregulated among trisomy 21, euploid, and DSCAM-KD cerebral organoids. (L) Dot plot showing DSCAM expression levels in multiple clusters among trisomy 21, euploid, and DSCAM-KD cerebral organoids. The size of each circle reflects the percentage of cells in a cluster where DSCAM was detected, and the color intensity reflects the average expression level within each cluster. (M and N) Representative Western blots of DSCAM, PAK1, and p-PAK1 levels in trisomy 21 and DSCAM-KD organoids. (OQ) Representative relative quantitation of DSCAM, PAK1, and p-PAK1 expression levels in trisomy 21 and DSCAM-KD organoids. n ≥3 independent experiments. Data represent the mean ± SEM. *P < 0.05, **P < 0.01, and ***P < 0.001, by 1-way ANOVA followed by Dunnett’s multiple-comparison test.
Figure 7
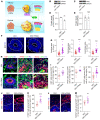
Figure 7. Knocking down DSCAM rescues abnormal neurogenesis in DS-derived cortical cultures.
(A) Representative images of day-30 organoids stained with Hoechst, which show the quantitation of the different parameters. Scale bar: 50 μm. (B and C) Quantitation of the basal membrane length and loop tissue area in the neuroepithelial loops of trisomy 21 and euploid organoids after 30 days of differentiation. Organoids (n ≥15) from 3 independent biologic replicate experiments were analyzed for each cell line. Data represent the mean ± SEM. *P < 0.05 and **P < 0.01, by 1-way ANOVA followed by Dunnett’s multiple-comparison test. (D) Representative images of day-30 trisomy 21 and DSCAM-KD organoids stained for Ki67, SOX2, PAX6, MAP2, CTIP2, and TUJ1 expression. Scale bar, 50 μm. (E) Quantification of the proportion of Ki67+, SOX2+, and PAX6+ cells in day-30 trisomy 21 and DSCAM-KD organoids. n = 17–33 VZ-like regions in at least 10 organoids per cell line. Data represent the mean ± SEM. **P < 0.01 and ***P < 0.001, by 1-way ANOVA followed by Dunnett’s multiple-comparison test. (F and G) Immunocytochemical staining and quantification of CTIP2+ cells in both trisomy 21 and DSCAM-KD organoids after 50 days of differentiation. n = 13–15 neural tube–like regions in at least 7 organoids per cell line. Data represent the mean ± SEM. ***P < 0.001, by 1-way ANOVA followed by Dunnett’s multiple-comparison test. Scale bar: 35 μm. (H and I) Immunocytochemical staining and quantification of the proportion of SATB2+ cells in both trisomy and DSCAM-KD organoids on day 70. n = 11 neural tube–like regions in at least 6 organoids per cell line. Data represent the mean ± SEM. ***P < 0.001, by Student’s t test. Scale bar: 35 μm.
Figure 8
Figure 8. Downregulation of PAK1 rescues proliferation and neurogenesis deficits in DS.
(A) Schematic of PAK1 correction. (B and C) Western blot detection of PAK1 and p-PAK1 expression in trisomy 21 organoids 30 days after treatment with FRAX486 (FRAX). (D and E) Western blot analysis of PAK1 and p-PAK1 expression in trisomy 21 organoids 30 days after treatment with FRAX486. n ≥3 independent experiments. Data represent the mean ± SEM. **P < 0.01, by Student’s t test. (F) Images showing outlines of the different parameters in trisomy 21 organoids and rescued organoids on day 30. Scale bar: 50 μm. (G) Quantitation of the different parameters of neuroepithelial loops in trisomy 21 and rescued organoids. Organoids (n ≥10) from 3 independent biological replicate experiments were analyzed for each cell line. Data represent the mean ± SEM. ***P < 0.001, by Student’s t test. (H) Representative images of trisomy 21 and rescued organoids stained for Ki67, SOX2, PAX6, MAP2, CTIP2, and TUJ1. Scale bars: 20 μm. (I) Proportion of Ki67+, SOX2+, and PAX6+ cells in trisomy 21 and rescued organoids on day 30. n = 10–30 VZ-like regions in at least 6 organoids per cell line. Data represent the mean ± SEM. *P < 0.05, **P < 0.01, and ***P < 0.001, by Student’s t test. (J and K) Immunocytochemical staining and quantification of the proportion of CTIP2+ cells in day-50 trisomy 21 and rescued organoids. n = 13–14 neural tube–like regions in at least 7 organoids per cell line. Data represent the mean ± SEM. ***P < 0.001, by Student’s t test. Scale bar: 35 μm. (L and M) Immunocytochemical staining and quantification of the proportion of SATB2+ cells in day-70 trisomy 21 and rescued organoids. n = 9–14 neural tube–like regions in at least 6 organoids per cell line. Data represent the mean ± SEM. **P < 0.01, by Student’s t test. Scale bar: 35 μm.

Similar articles

Cited by

References

    1. Hibaoui Y, et al. Modelling and rescuing neurodevelopmental defect of Down syndrome using induced pluripotent stem cells from monozygotic twins discordant for trisomy 21. EMBO Mol Med. 2014;6(2):259–277. doi: 10.1002/emmm.201302848. - DOI - PMC - PubMed
    1. Golden JA, Hyman BT. Development of the superior temporal neocortex is anomalous in trisomy 21. J Neuropathol Exp Neurol. 1994;53(5):513–520. doi: 10.1097/00005072-199409000-00011. - DOI - PubMed
    1. Chakrabarti L, et al. Defects in embryonic neurogenesis and initial synapse formation in the forebrain of the Ts65Dn mouse model of Down syndrome. J Neurosci. 2007;27(43):11483–11495. doi: 10.1523/JNEUROSCI.3406-07.2007. - DOI - PMC - PubMed
    1. Schapiro MB, et al. Serial quantitative CT analysis of brain morphometrics in adult Down’s syndrome at different ages. Neurology. 1989;39(10):1349–1353. doi: 10.1212/WNL.39.10.1349. - DOI - PubMed
    1. Coyle JT, et al. The neurobiologic consequences of Down syndrome. Brain Res Bull. 1986;16(6):773–787. doi: 10.1016/0361-9230(86)90074-2. - DOI - PubMed

Publication types