Clinical Trial
. 2021 Jun 15;131(12):e149125.
doi: 10.1172/JCI149125.

Relationship of SARS-CoV-2-specific CD4 response to COVID-19 severity and impact of HIV-1 and tuberculosis coinfection

Affiliations
Clinical Trial

Relationship of SARS-CoV-2-specific CD4 response to COVID-19 severity and impact of HIV-1 and tuberculosis coinfection

Catherine Riou et al. J Clin Invest. .

Abstract

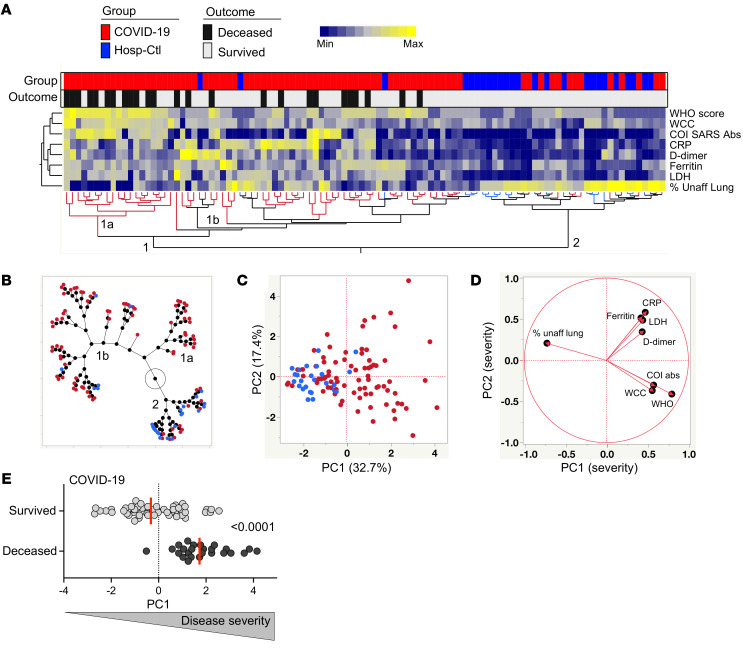
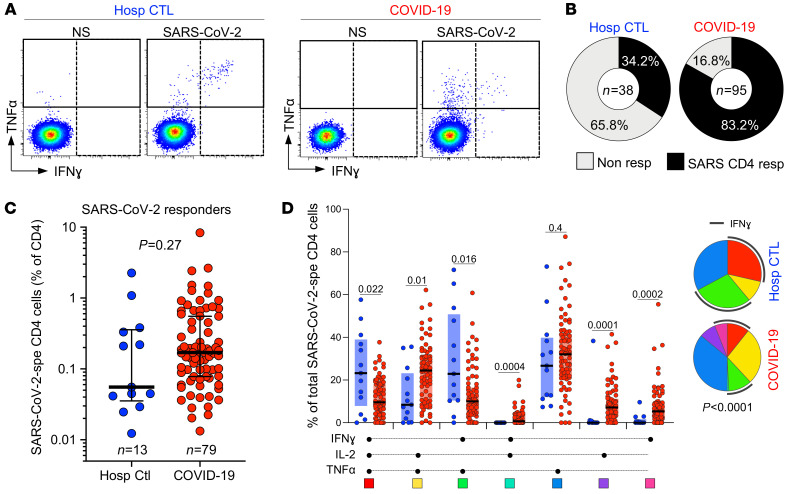
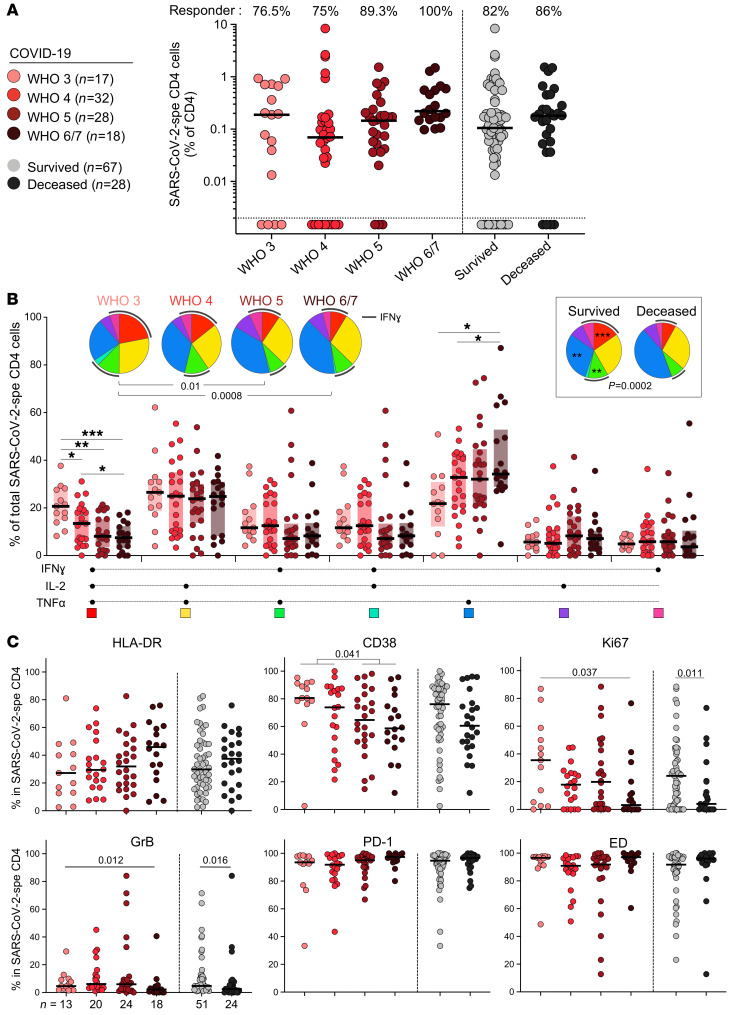
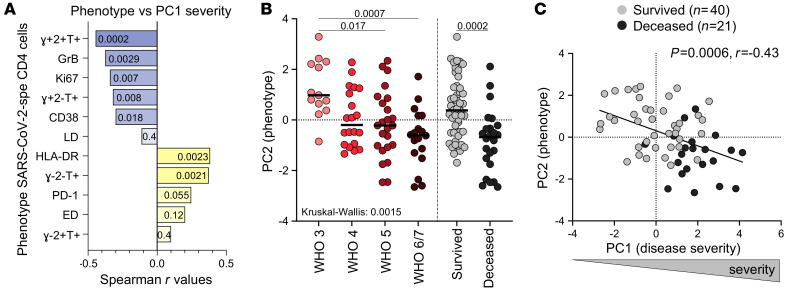
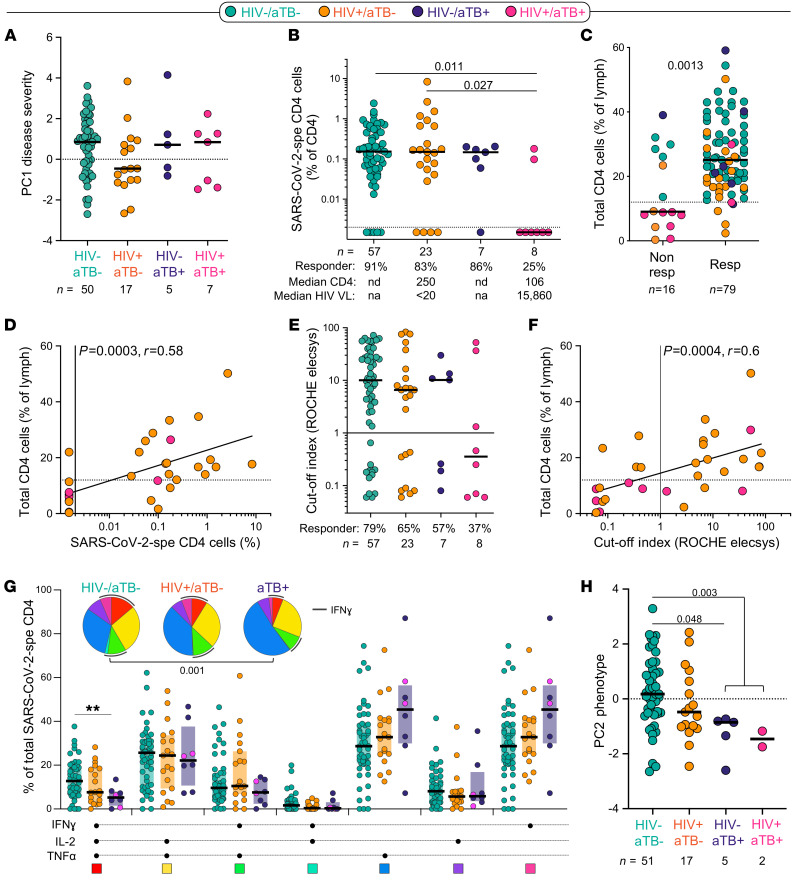
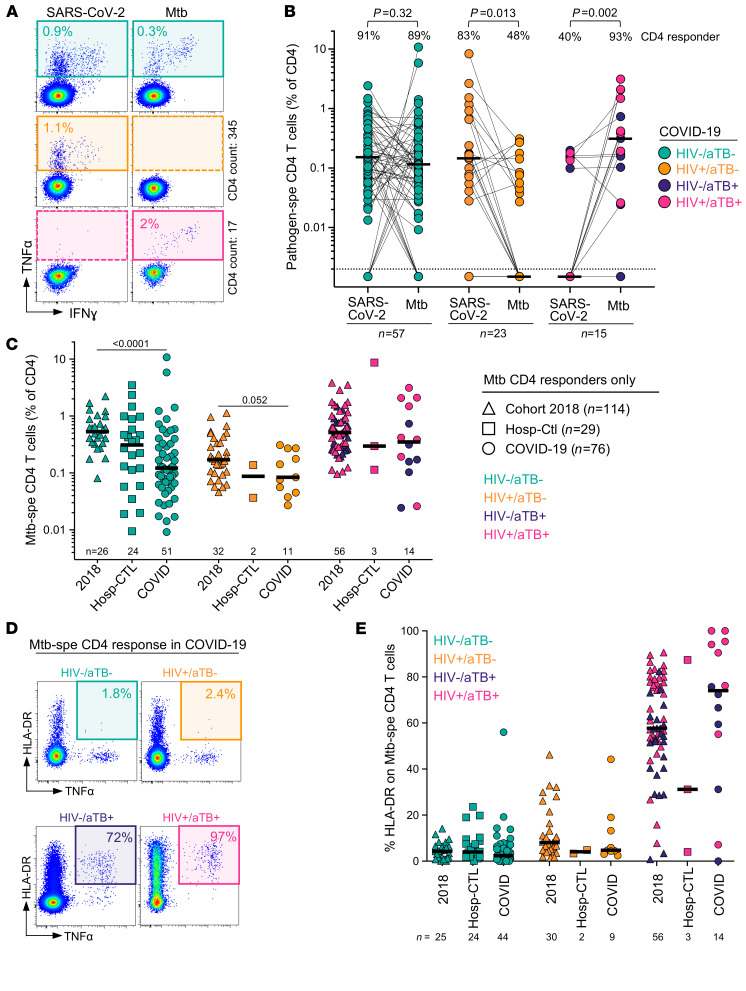
T cells are involved in control of coronavirus disease 2019 (COVID-19), but limited knowledge is available on the relationship between antigen-specific T cell response and disease severity. Here, we used flow cytometry to assess the magnitude, function, and phenotype of SARS coronavirus 2-specific (SARS-CoV-2-specific) CD4+ T cells in 95 hospitalized COVID-19 patients, 38 of them being HIV-1 and/or tuberculosis (TB) coinfected, and 38 non-COVID-19 patients. We showed that SARS-CoV-2-specific CD4+ T cell attributes, rather than magnitude, were associated with disease severity, with severe disease being characterized by poor polyfunctional potential, reduced proliferation capacity, and enhanced HLA-DR expression. Moreover, HIV-1 and TB coinfection skewed the SARS-CoV-2 T cell response. HIV-1-mediated CD4+ T cell depletion associated with suboptimal T cell and humoral immune responses to SARS-CoV-2, and a decrease in the polyfunctional capacity of SARS-CoV-2-specific CD4+ T cells was observed in COVID-19 patients with active TB. Our results also revealed that COVID-19 patients displayed reduced frequency of Mycobacterium tuberculosis-specific CD4+ T cells, with possible implications for TB disease progression. These results corroborate the important role of SARS-CoV-2-specific T cells in COVID-19 pathogenesis and support the concept of altered T cell functions in patients with severe disease.

Keywords: AIDS/HIV; COVID-19; Cellular immune response; T cells; Tuberculosis.


Conflict of interest statement

Conflict of interest: The authors have declared that no conflict of interest exists.

Figures

Figure 1
Figure 1. Measures of COVID-19 disease severity.
(A) An unsupervised 2-way hierarchical cluster analysis (HCA, Ward’s method) was employed to grade COVID-19 disease, using the WHO ordinal scale scoring, Roche Elecsys anti–SARS-CoV-2 antibody cutoff index, WCC, CRP, D-dimer, ferritin, LDH, and radiographic evidence of disease extent expressed as percentage of unaffected lung. COVID-19 status (COVID-19 cases in red and SARS-CoV-2–uninfected hospitalized controls in blue) and outcome (survived in white and deceased in black) of each patient is indicated at the top of the dendrogram. Data are depicted as a heatmap colored from minimum to maximum values detected for each parameter. (B) Constellation plot-cluster analysis based on all measured parameters. Each dot represents a participant and is color-coded according to his or her COVID-19 status. Each cluster obtained for the HCA is identified by a number. (C) Principal component analysis (PCA) on correlations, based on the 8 clinical parameters, was used to explain the variance of the data distribution in the cohort. Each dot represents a participant. The 2 axes represent principal components 1 (PC1) and 2 (PC2). Their contribution to the total data variance is shown as a percentage. (D) Loading plot showing how each parameter influences PC1 and PC2 values. (E) Comparison of PC1 score values between COVID-19 cases who survived and those who died. Bars represent medians. Statistical comparisons were calculated using the nonparametric Mann-Whitney U test. Only participants with complete clinical data were included in the analysis (n = 79 COVID-19 patients and n = 25 hospitalized controls).
Figure 2
Figure 2. Prevalence, magnitude, and functional profile of SARS-CoV-2–specific CD4+ T cells between COVID-19 cases and SARS-CoV-2–uninfected hospitalized patients.
(A) Representative flow cytometry plots of IFN-γ and TNF-α expression. NS, no stimulation. (B) Proportion of patients exhibiting a detectable SARS-CoV-2 CD4 response in each group. The number of studied patients is indicated in the pie (n = 79 COVID-19 patients and n = 25 hospitalized controls). (C) Frequency of SARS-CoV-2–specific CD4+ T cells in hospitalized control (blue, n = 13) and COVID-19 responders (red, n = 79). Statistical comparisons were calculated using the nonparametric Mann-Whitney U test. (D) Polyfunctional profile of SARS-CoV-2–specific CD4+ T cells in hospitalized controls and COVID-19 patients. The median and IQR are shown. Each response pattern is color-coded, and data are summarized in the pie charts. Wilcoxon’s rank test was used to compare response patterns between groups. Statistical differences between pies were defined using a permutation test.
Figure 3
Figure 3. Memory and activation profile of SARS-CoV-2–specific CD4+ T cells between COVID-19 cases and SARS-CoV-2–uninfected hospitalized patients.
(A) Overlay flow plots of CD45RA, CD27, PD-1, GrB, CD38, and HLA-DR expression. Dots depict SARS-CoV-2–specific CD4+ T cells and density plots depict total CD4+ T cells. Four memory subsets can be delineated: naive (CD45RA+CD27+), early differentiated (ED, CD45RACD27+), late differentiated (LD, CD45RACD27), and effector (Eff, CD45RA+CD27). (B) Summary graphs of the expression of each marker in SARS-CoV-2–specific CD4+ T cells (n = 75 COVID-19 patients and n = 12 hospitalized controls). The phenotype of SARS-CoV-2–specific CD4+ T cells was assessed only in those with response greater than 20 events. Bars represent medians. Statistical comparisons were calculated using the nonparametric Mann-Whitney U test. (C) Heatmap of pairwise Spearman’s correlations between phenotypical and functional traits of SARS-CoV-2–specific CD4+ T cells. Spearman’s rank r correlation values are shown from blue, –1, to yellow, 1. The red box identifies the profile of ED SARS-CoV-2–specific CD4+ T cells and the blue box the profile of LD cells enriched in hospitalized controls. (D) PCA (left) based on the 8 phenotypical and functional attributes of SARS-CoV-2–specific CD4+ T cells (LD, GrB, HLA-DR, Ki67, CD38 and the proportion of IFN-γ+IL-2+TNF-α+, IFN-γ+IL-2TNF-α+, and IFN-γIL-2TNF-α+ cells) and corresponding loading plot (right).
Figure 4
Figure 4. SARS-CoV-2–specific CD4+ T cell response in COVID-19 cases stratified by WHO ordinal scale score and outcome.
(A) Prevalence and frequency of SARS-CoV-2–specific CD4+ T cells in COVID-19 cases. Patients were stratified according to WHO ordinal score and outcome. (B) Polyfunctional profile of SARS-CoV-2–specific CD4+ T cells in COVID-19 cases stratified by WHO score and outcome. Wilcoxon’s rank test was used to compare response patterns between groups (*P < 0.05, **P < 0.01, ***P < 0.001). Statistical differences between pie charts were defined using a permutation test. (C) Memory and activation profile of SARS-CoV-2–specific CD4+ T cells in COVID-19 cases stratified by WHO score and outcome. The phenotype of SARS-CoV-2–specific CD4+ T cells was assessed only in those with response greater than 20 events (n = 75 COVID-19 patients). Statistical comparisons were defined using a Kruskal-Wallis test, adjusted for multiple comparisons (Dunn’s test) for the different WHO groups and the Mann-Whitney U test to compare COVID-19 patients who survived or died.
Figure 5
Figure 5. Relationship between COVID-19 severity and functional and phenotypical traits of SARS-CoV-2–specific CD4+ T cells.
(A) Spearman’s correlation r values between indicated SARS-CoV-2–specific CD4+ T cell features and COVID-19 severity (defined by the composite analysis of clinical parameters, PC1 severity). Negative associations are represented in blue and positive associations in yellow. P values are indicated for each comparison. (B) Comparison of the overall profile of SARS-CoV-2–specific CD4+ T cells (PC2 phenotype) in COVID-19 cases (n = 74) stratified by WHO ordinal score and outcome. Statistical comparisons were defined using a Kruskal-Wallis test, adjusted for multiple comparisons (Dunn’s test) for the different WHO groups and the Mann-Whitney U test to compare COVID-19 patients who survived or died. (C) Association between COVID-19 severity (PC1 severity) and the overall profile of SARS-CoV-2–specific CD4+ T cells (PC2 phenotype). COVID-19 survivors are depicted in gray and patients who died in black. Correlation was tested by a 2-tailed nonparametric Spearman’s rank test.
Figure 6
Figure 6. Impact of HIV, aTB, and HIV/aTB coinfection on SARS-CoV-2–specific CD4+ T cell response.
(A) Comparison of COVID-19 severity (defined by the composite analysis of clinical parameters, PC1 severity) between patients grouped according to HIV and/or aTB coinfection. (B) Prevalence and frequencies of SARS-CoV-2–specific CD4+ T cells in COVID-19 patients stratified by HIV and/or aTB coinfection. Statistical comparisons were defined using a Kruskal-Wallis test adjusted for multiple comparisons (Dunn’s test). (C) Comparison of the frequency of total CD4+ T cells between SARS-CoV-2 CD4 responders and nonresponders. Dots are color-coded according to patient’s HIV and TB status. Statistical comparison was performed using the Mann-Whitney U test. (D) Association between the frequency of SARS-CoV-2–specific CD4+ T cells and total CD4+ T cells in HIV-infected COVID-19 patients. Correlation was tested by a 2-tailed nonparametric Spearman’s rank test. (E) Prevalence and magnitude of SARS-CoV-2–specific serological response (defined using the Roche Elecsys assay) in COVID-19 patients stratified by HIV and/or aTB coinfection. (F) Association between the magnitude of SARS-CoV-2–specific serological response and the frequency of total CD4+ T cells in HIV-infected COVID-19 patients. Correlation was tested by a 2-tailed nonparametric Spearman’s rank test. (G) Polyfunctional profile of SARS-CoV-2–specific CD4+ T cells in COVID-19 cases stratified by HIV or aTB coinfection. For this analysis, HIV/aTB+ and HIV+/aTB+ patients were combined in 1 group (aTB). Dots are color-coded according to patients’ HIV and TB status. Wilcoxon’s rank test was used to compare response patterns between groups (**P < 0.01). Statistical differences between pie charts were defined using a permutation test. (H) Comparison of the overall profile of SARS-CoV-2–specific CD4+ T cells (PC2 phenotype) in COVID-19 cases stratified by HIV or aTB coinfection. Statistical comparisons were defined using a Kruskal-Wallis test adjusted for multiple comparisons (Dunn’s test).
Figure 7
Figure 7. Impact of COVID-19 on M.
tuberculosis–specific CD4+ T cell response. (A) Representative examples of flow cytometry plots of SARS-CoV-2– and M. tuberculosis–specific CD4+ T cell responses in 3 COVID-19 patients (1 HIV/aTB, 1 HIV+/aTB, and 1 HIV+/aTB+). (B) Comparison of the prevalence and frequencies of SARS-CoV-2– and M. tuberculosis–specific CD4+ T cells in COVID-19 patients stratified by HIV or aTB coinfection. The proportion of responders to each pathogen (S: SARS-CoV-2 and M: M. tuberculosis) is presented with pies at the top of the graph. Statistical comparisons were performed using the χ2 test. Participants were grouped according to their HIV and/or TB status. Black bars represent the medians. (C) Comparisons of the frequencies of M. tuberculosis–specific CD4+ T cells in a cohort recruited before the emergence of COVID-19 (2018, n = 114), SARS-CoV-2–uninfected hospitalized controls (n = 29), and COVID-19 cases (n = 76). Participants were stratified according to their HIV and/or TB status. Statistical comparisons were defined using a Kruskal-Wallis test adjusted for multiple comparisons (Dunn’s test) for each subgroup. (D) Representative flow cytometry plots of HLA-DR expression on TNF-α–producing M. tuberculosis–specific CD4+ T cells in 3 COVID-19 patients (1 HIV/aTB, 1 HIV+/aTB, and 1 HIV+/aTB+). (E) Summary graph of HLA-DR expression on M. tuberculosis–specific CD4+ T cells in a cohort recruited before the emergence of COVID-19 (2018), SARS-CoV-2–uninfected hospitalized controls, and COVID-19 cases stratified according to HIV and TB status. The phenotype of M. tuberculosis–specific CD4+ T cells was assessed only in those with response greater than 20 events.

References

    1. Huang C, et al. Clinical features of patients infected with 2019 novel coronavirus in Wuhan, China. Lancet. 2020;395(10223):497–506. doi: 10.1016/S0140-6736(20)30183-5. - DOI - PMC - PubMed
    1. Clark A, et al. Global, regional, and national estimates of the population at increased risk of severe COVID-19 due to underlying health conditions in 2020: a modelling study. Lancet Glob Health. 2020;8(8):e1003–e1017. doi: 10.1016/S2214-109X(20)30264-3. - DOI - PMC - PubMed
    1. Zhou R, et al. Acute SARS-CoV-2 infection impairs dendritic cell and T cell responses. Immunity. 2020;53(4):864–877. doi: 10.1016/j.immuni.2020.07.026. - DOI - PMC - PubMed
    1. Mathew D, et al. Deep immune profiling of COVID-19 patients reveals distinct immunotypes with therapeutic implications. Science. 2020;369(6508):eabc8511. doi: 10.1126/science.abc8511. - DOI - PMC - PubMed
    1. Chen Z, John Wherry E. T cell responses in patients with COVID-19. Nat Rev Immunol. 2020;20(9):529–536. doi: 10.1038/s41577-020-0402-6. - DOI - PMC - PubMed

Publication types