. 2021 May 4;19(5):e3001234.
doi: 10.1371/journal.pbio.3001234. eCollection 2021 May.

Neural oscillations are a start toward understanding brain activity rather than the end

Affiliations

Neural oscillations are a start toward understanding brain activity rather than the end

Keith B Doelling et al. PLoS Biol. .

Abstract

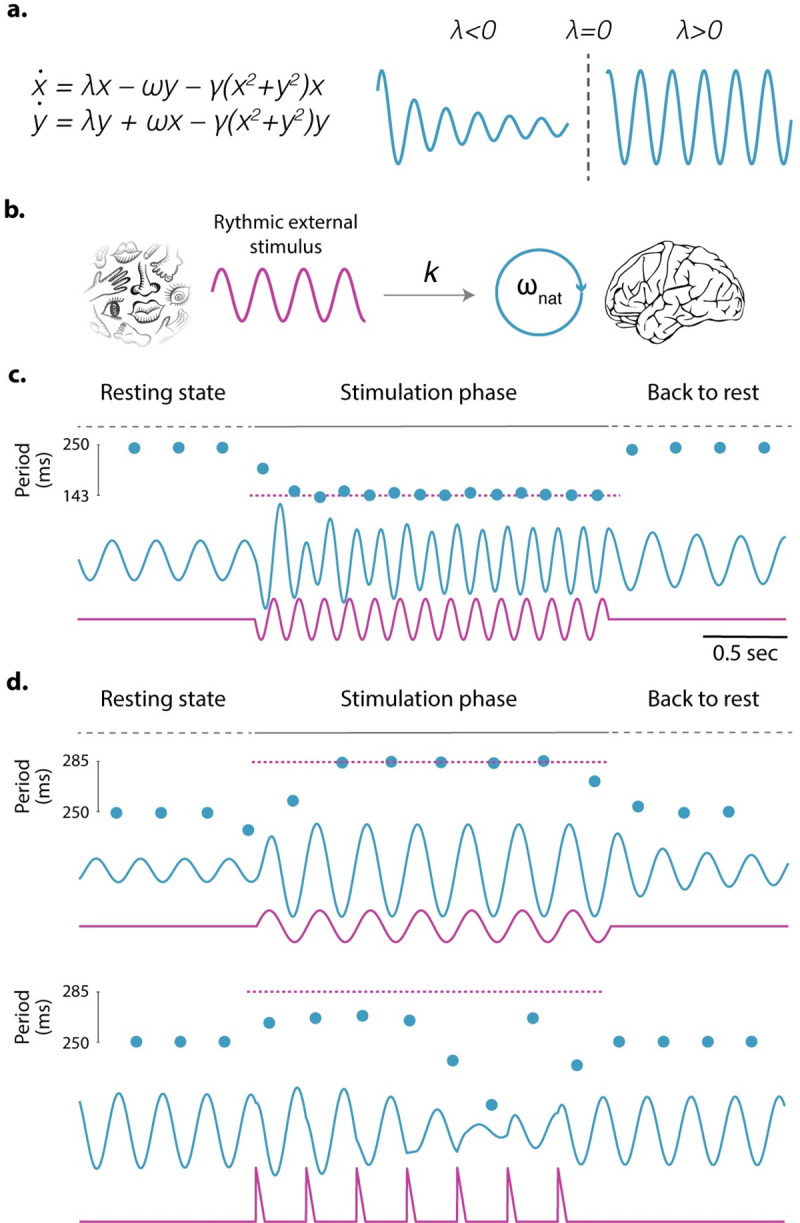
Does rhythmic neural activity merely echo the rhythmic features of the environment, or does it reflect a fundamental computational mechanism of the brain? This debate has generated a series of clever experimental studies attempting to find an answer. Here, we argue that the field has been obstructed by predictions of oscillators that are based more on intuition rather than biophysical models compatible with the observed phenomena. What follows is a series of cautionary examples that serve as reminders to ground our hypotheses in well-developed theories of oscillatory behavior put forth by theoretical study of dynamical systems. Ultimately, our hope is that this exercise will push the field to concern itself less with the vague question of "oscillation or not" and more with specific biophysical models that can be readily tested.


Conflict of interest statement

The authors have declared that no competing interests exist.

Figures

Fig 1
Fig 1. A neural oscillator can be represented by an HA bifurcation.
(a) The set of equations displayed in the figure, known as Stuart–Landau equations, goes through an HA bifurcation at λ = 0. For λ below this critical value, x(t) (blue trace on the left) shows a damped oscillatory regime; when λ surpasses 0, x(t) (blue trace on the right) starts oscillating with a frequency of ω. (a) Schematic representation of the oscillator driven bottom-up by an external rhythmic stimulus. Simulations are run for a neural oscillator with a natural frequency ωnat = 4 Hz forced by a periodic external stimulus of period τ, s(t) = s(t + τ). The external stimulus is added as an extra term in the equation driving x’s dynamics. The set of equations in panel a is modified as x˙=λxωnatyγ(x2+y2)+ks(t). The parameter k represents the strength of the coupling between the neural oscillator and the external stimulus. (c and d) Oscillator’s response (x(t), blue traces) when forced by different rhythmic stimuli (magenta traces). Blue dots: time evolution of the oscillator’s period. Magenta dashed line: period of the external stimulus. For all simulations, parameters were fixed at ωnat = 2π 4, λ = 0.1 and γ = 1. For panel c, k = 25 and s(t) a sinusoid with a frequency fixed at 7 Hz. For panel d, k = 50 and s(t) is a sinusoid, for the upper panel, and a periodic train of triangle pulses for the lower one, both with a frequency fixed at 3.5 Hz. HA, Hopf–Andronov.
Fig 2
Fig 2. Simulations for different interactions of the neural oscillator with an external stimulus.
(a) Schematic representation of the model used to run the simulations shown in panels b and c: The neural oscillator is driven top-down and/or bottom-up by an external stimulus. The model assumes the same bottom-up interaction as in Fig 1, but this time, it can be modulated by a top-down mechanism. Mathematically, it implies that λ is shifted by the presence of an external input. (b) The oscillator receives a constant external input, and λ is top-down modified by the onset of the stimulus. Simulation parameters are ωnat = 2π 4, γ = 1, k = 50, and s(t) a step function switching from 0 to 1. (c) The oscillator is only bottom-up driven by a rhythmic stimulation. Simulation parameters are ωnat = 2π 4, γ = 1, k = 25, and s(t) a sinusoid is a sinusoid with a frequency fixed at 3.5 Hz. (d) Schematic representation of the model used to run the simulations shown in panel e: The neural oscillator is driven bottom-up by a single event. (e) Oscillator’s response when forced by a single stimulus. Once the external perturbation ceases, the oscillator resumes its natural ongoing activity but with a phase lag. The same stimulus resets the ongoing oscillation to different values (θ01, θ02) depending on the initial phase. Dashed lines: unperturbed oscillator’s activity. Simulation parameters are ωnat = 2π 4, γ = 0.1, and k = 50. Blue traces: oscillator’s response, i.e., x(t). Magenta traces: external stimulus, i.e., s(t). Blue dots: time evolution of the oscillator’s period.
Fig 3
Fig 3. An oscillator can handle some irregularity.
(a) The output of the Stuart–Landau model (x(t) shown in blue) in response to an example quasi-rhythmic stimulus (s(t) in magenta) that was drawn from Gaussian distributions whose means are centered in a rhythmic fashion (P in gray). Gaussian distributions have a standard deviation of 20% of expected time between tones creating substantial deviations from rhythmicity. The dashed black line shows where the mean of the next Gaussian distribution would be and therefore the expected location of the next tone if there were one. It lines up well with the peak of the oscillator. (b) A histogram of the phase extracted at the dashed line in panel a over 500 different stimuli. Phase clustering suggests that the oscillator phase contains information regarding timing of expected tones. Simulation parameters are ωnat = 2π 4, λ = 1, γ = 1, k = 10, and s(t) is made up of 100-ms square steps with each onset drawn from a distribution in P. P is a set of Gaussians with μ = 0.25a, where a is {0, 1, 2,…, 9} and σ = 0.05.
Fig 4
Fig 4. Comparison between an oscillator and a non-oscillator–like systems.
(a) Upper panel: set of equations defining the different models. An oscillator-like model (Stuart–Landau) on the left; a linear model on the right. Lower panel: system’s behavior for different frequency values (ωext) of the external rhythmic signal (S). For the oscillator, the synchronization between the system and the external force vanishes when the external frequency departs from the internal one (gray area in the left panel); for the linear model, instead, synchrony exists regardless of the value adopted by the external frequency. (b) Behavior of the 2 models (blue traces; oscillator on the left, linear model on the right) for rhythmic inputs (magenta traces) of different frequencies (colored dots; red, yellow, and green correspond to ωext = 4.5, 5, and 6.2 Hz, respectively). The lower panel displays in gray the time evolution of the phase difference between the system output and the corresponding input.

Comment in

References

    1. Buzsáki G, Logothetis N, Singer W. Scaling Brain Size, Keeping Timing: Evolutionary Preservation of Brain Rhythms. Neuron. 2013. October 30;80(3):751–64. 10.1016/j.neuron.2013.10.002 - DOI - PMC - PubMed
    1. Huygens C. lettre à son père, in øeuvres complètes de christiaan huygens, 1665. Société Holl Sci. 1893;5:243–4.
    1. Graf RF. Modern Dictionary of Electronics. Elsevier Science; 1999. p. 884.
    1. Luo H, Poeppel D. Phase patterns of neuronal responses reliably discriminate speech in human auditory cortex. Neuron. 2007;54(6):1001–10. 10.1016/j.neuron.2007.06.004 - DOI - PMC - PubMed
    1. Ghitza O, Greenberg S. On the possible role of brain rhythms in speech perception: intelligibility of time-compressed speech with periodic and aperiodic insertions of silence. Phonetica. 2009;66(1–2):113–26. 10.1159/000208934 - DOI - PubMed

LinkOut - more resources