. 2021 May 4;17(5):e1009021.
doi: 10.1371/journal.pgen.1009021. eCollection 2021 May.

Evaluation of polygenic prediction methodology within a reference-standardized framework

Affiliations

Evaluation of polygenic prediction methodology within a reference-standardized framework

Oliver Pain et al. PLoS Genet. .

Abstract

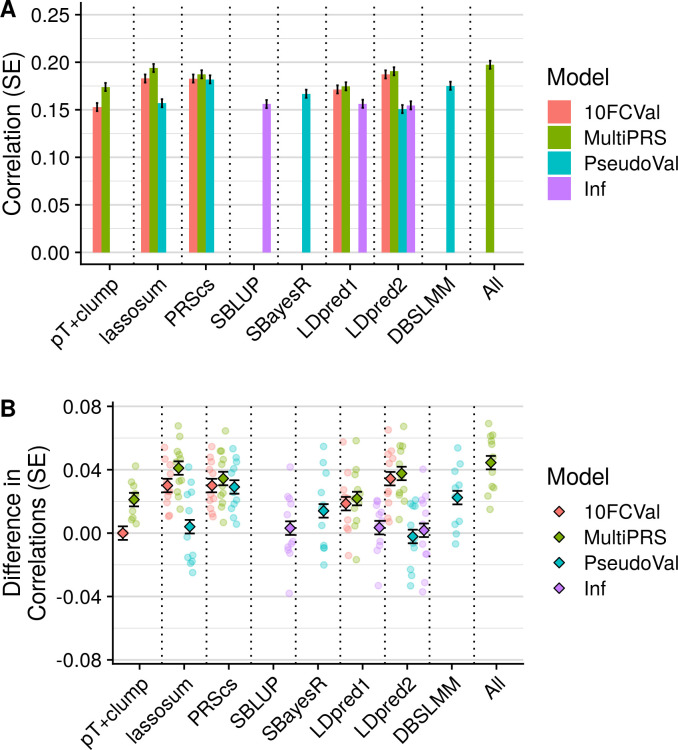
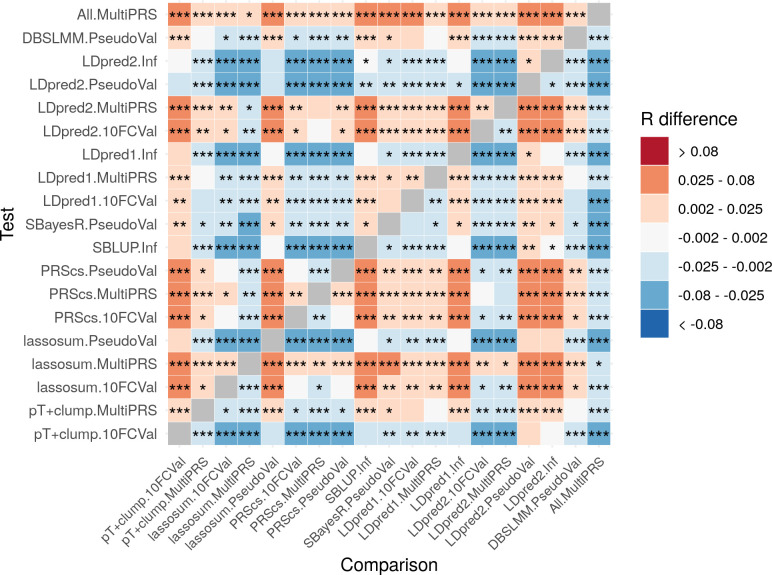
The predictive utility of polygenic scores is increasing, and many polygenic scoring methods are available, but it is unclear which method performs best. This study evaluates the predictive utility of polygenic scoring methods within a reference-standardized framework, which uses a common set of variants and reference-based estimates of linkage disequilibrium and allele frequencies to construct scores. Eight polygenic score methods were tested: p-value thresholding and clumping (pT+clump), SBLUP, lassosum, LDpred1, LDpred2, PRScs, DBSLMM and SBayesR, evaluating their performance to predict outcomes in UK Biobank and the Twins Early Development Study (TEDS). Strategies to identify optimal p-value thresholds and shrinkage parameters were compared, including 10-fold cross validation, pseudovalidation and infinitesimal models (with no validation sample), and multi-polygenic score elastic net models. LDpred2, lassosum and PRScs performed strongly using 10-fold cross-validation to identify the most predictive p-value threshold or shrinkage parameter, giving a relative improvement of 16-18% over pT+clump in the correlation between observed and predicted outcome values. Using pseudovalidation, the best methods were PRScs, DBSLMM and SBayesR. PRScs pseudovalidation was only 3% worse than the best polygenic score identified by 10-fold cross validation. Elastic net models containing polygenic scores based on a range of parameters consistently improved prediction over any single polygenic score. Within a reference-standardized framework, the best polygenic prediction was achieved using LDpred2, lassosum and PRScs, modeling multiple polygenic scores derived using multiple parameters. This study will help researchers performing polygenic score studies to select the most powerful and predictive analysis methods.


Conflict of interest statement

I have read the journal’s policy and the authors of this manuscript have the following competing interests: Cathryn Lewis sits on the Myriad Neuroscience Scientific Advisory Board. The other authors declare no competing interests.

Figures

Fig 1
Fig 1. Schematic diagram of reference-standardized polygenic scoring.
1KG = 1000 Genomes; LDSC = Linkage Disequiibrium Score Regression; MAF = Minor allele Frequency; Pre-imputed genotype data = Indicates the observed genotype data has already been imputed; Observed genome-wide genotype data = Indicate the observed genotype data has not been imputed, and therefore requires imputation.
Fig 2
Fig 2. Polygenic scoring methods comparison for UKB target sample with 1KG reference.
A) Average test-set correlation between predicted and observed values across phenotypes. B) Average difference between observed-prediction correlations for the best pT+clump polygenic score and all other methods. The average difference across phenotypes are shown as diamonds and the difference for each phenotype shown as transparent circles. Shows only results based on the UKB target sample when using the 1KG reference. Error bars indicate standard error of correlations for each method. 10FCVal represents a single polygenic score based on the optimal parameter as identified using 10-fold cross-validation. Multi-PRS represents an elastic net model containing polygenic scores based on a range of parameters, with elastic net shrinkage parameters derived using 10-fold cross-validation. PseudoVal represents a single polygenic score based on the predicted optimal parameter as identified using pseudovalidation, which requires no tuning sample. Inf represents a single polygenic score based on the infinitesimal model, which requires no tuning sample.
Fig 3
Fig 3. Pairwise comparison between all methods, showing average test-set observed-expected correlation difference between all methods with significance value.
Correlation difference = Test correlation–Comparison correlation. Red/orange coloring indicates the Test method (shown on Y axis) performed better than the Comparison method (shown on X axis). Shows only results based on the UKB target sample when using the 1KG reference. * = p<0.05. ** = p<1×10⁻³. *** = p<1×10⁻⁶. P-values are two-sided. 10FCVal represents a single polygenic score based on the optimal parameter as identified using 10-fold cross-validation. Multi-PRS represents an elastic net model containing polygenic scores based on a range of parameters, with elastic net shrinkage parameters derived using 10-fold cross-validation. PseudoVal represents a single polygenic score based on the predicted optimal parameter as identified using pseudovalidation, which requires no tuning sample. Inf represents a single polygenic score based on the infinitesimal model, which requires no tuning sample.

References

    1. Polderman TJC, Benyamin B, de Leeuw CA, Sullivan PF, van Bochoven A, Visscher PM, et al.. Meta-analysis of the heritability of human traits based on fifty years of twin studies. Nat Genet. 2015;47: 702–9. 10.1038/ng.3285 - DOI - PubMed
    1. Manolio TA, Collins FS, Cox NJ, Goldstein DB, Hindorff LA, Hunter DJ, et al.. Finding the missing heritability of complex diseases. Nature. 2009;461: 747–753. 10.1038/nature08494 - DOI - PMC - PubMed
    1. Buniello A, MacArthur JAL, Cerezo M, Harris LW, Hayhurst J, Malangone C, et al.. The NHGRI-EBI GWAS Catalog of published genome-wide association studies, targeted arrays and summary statistics 2019. Nucleic Acids Res. 2019;47: D1005–D1012. 10.1093/nar/gky1120 - DOI - PMC - PubMed
    1. Consortium IS. Common polygenic variation contributes to risk of schizophrenia and bipolar disorder. Nature. 2009;460: 748. 10.1038/nature08185 - DOI - PMC - PubMed
    1. Dudbridge F. Power and Predictive Accuracy of Polygenic Risk Scores. PLoS Genet. 2013;9. 10.1371/journal.pgen.1003348 - DOI - PMC - PubMed

Publication types

LinkOut - more resources